Control Room: one wall for everything you steer on
A tour of everything a Control Room can do: more than thirty tile types, free layout, themes, pages, a wall mode, the phone - and a map of every way a tile can be fed: typed values, KPIs, files, web services, live data and the journey itself.
Coordination - see everything on one wall - 20 min. You need: an organisation. To change a board: be an admin.
Reading this changes nothing. In the pictures every window was closed with Cancel - nothing was saved.
What you will be able to do
- Read a board Status dots, trend lines, Example labels, pages.
- Build one Over thirty tile types; draw boxes, arrows and text between them.
- Feed it Typed, KPI, file, web service, live data, the journey itself.
- Show it Play mode, screens, themes, and a phone layout.
Get this ready first
- An organisation A Control Room is always about something. Open it and pick the organisation, then the journey.
- A board No board yet? The explainer Make a Control Room with AI builds one from a briefing in minutes.
Take the tour, one step at a time
Twenty-two steps in five parts: look, build, feed, settings, show. The pictures are a real board, made by Make with AI.
Read the wall
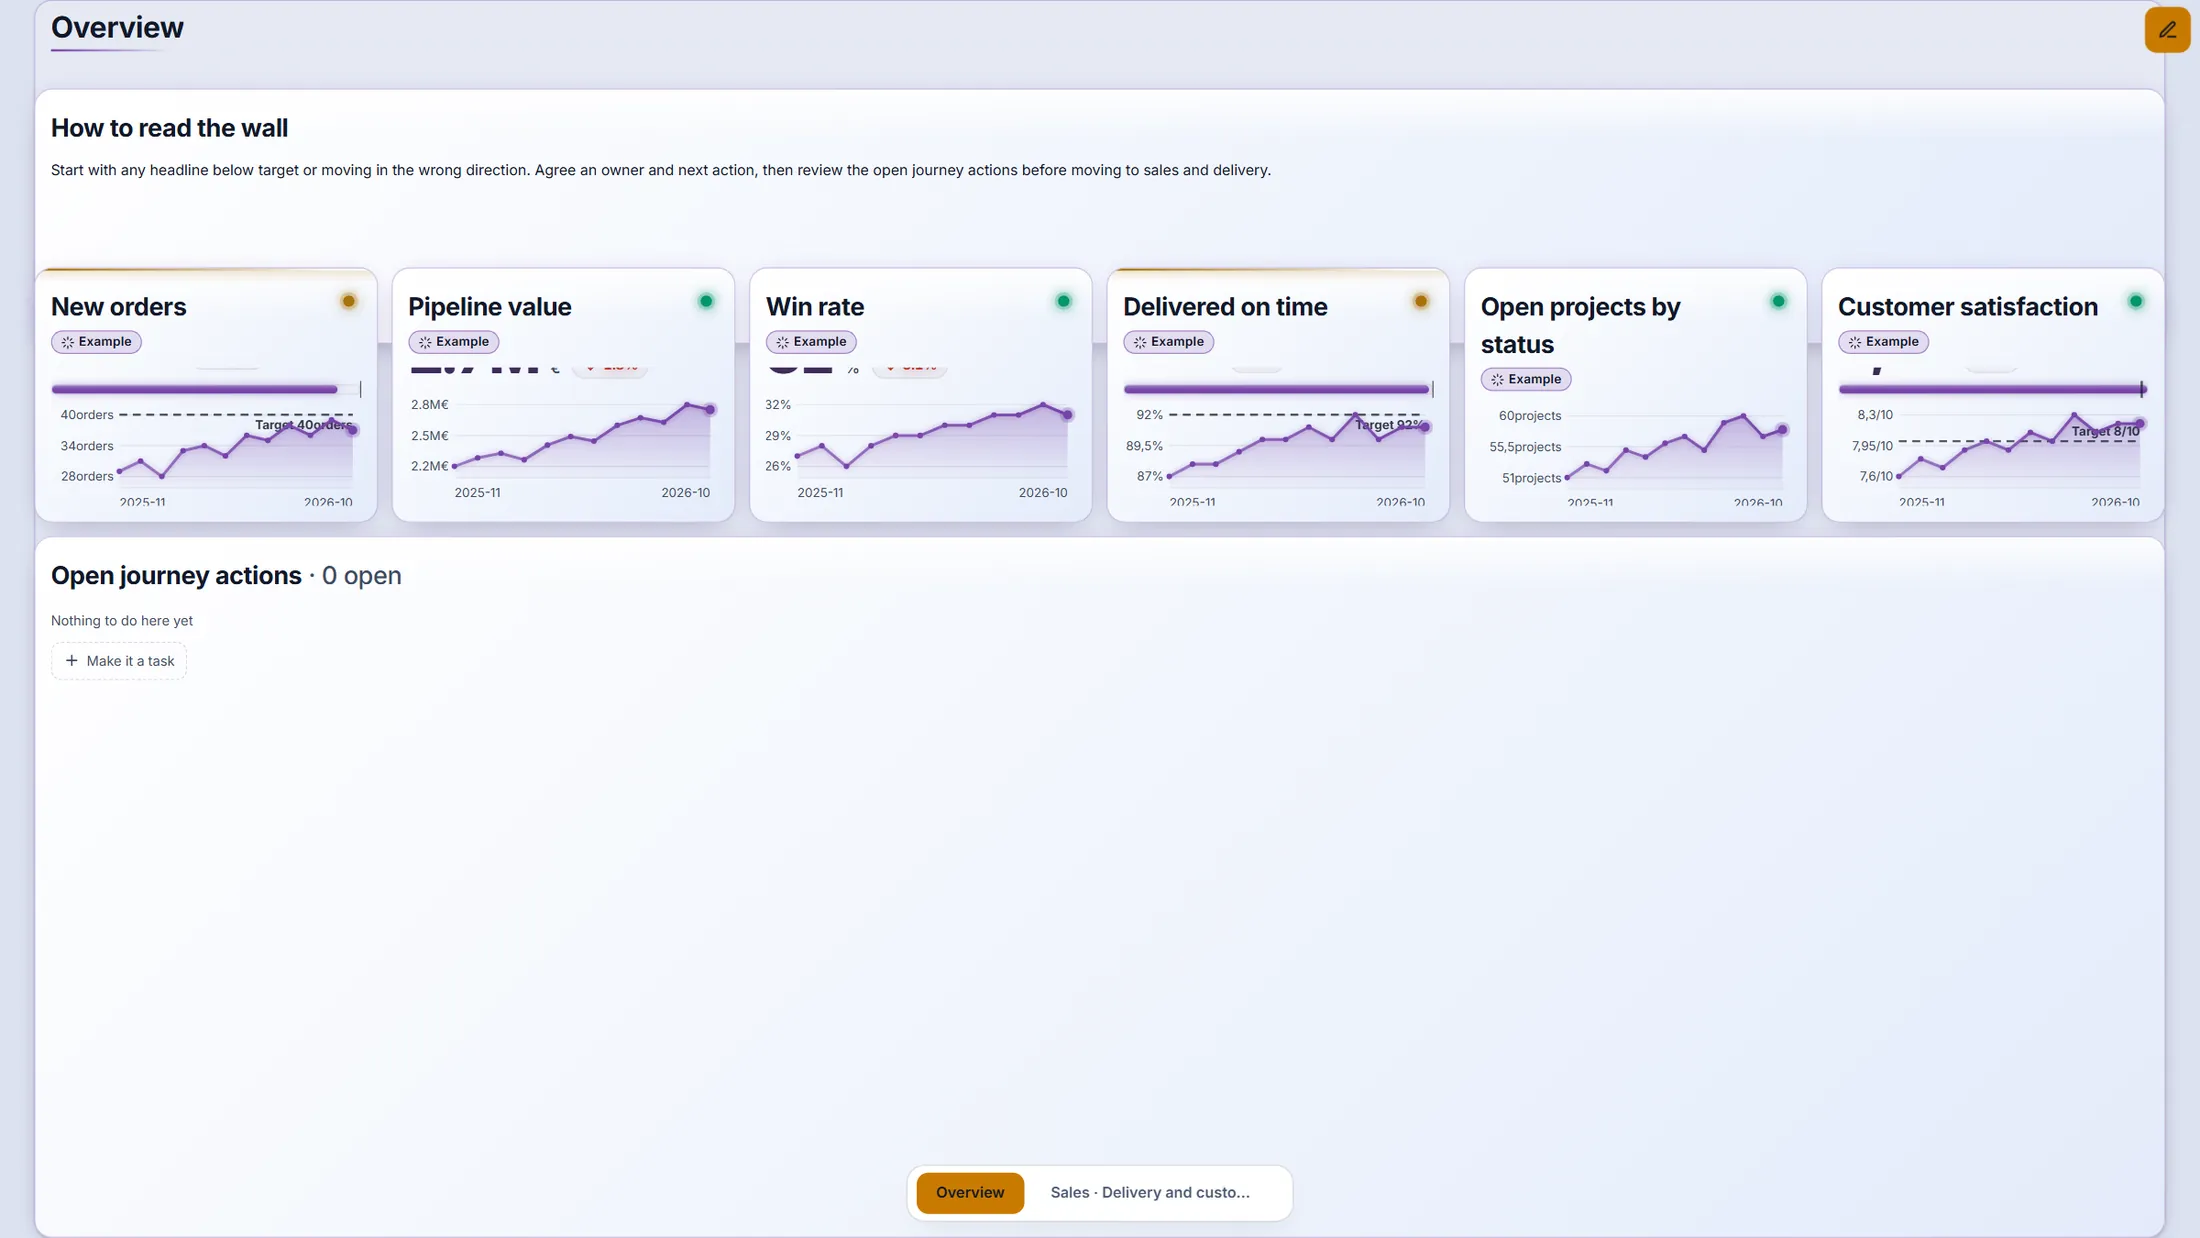
Every tile is one number or one list. The coloured dot says if it is on track.
- Open the Control Room. The first page, Overview , shows the headline numbers.
- Look at a tile: the title, an Example label (while the numbers are examples), the value, a trend line and the dashed target line.
- A tile with a list shows the Open journey actions of the journey - the same actions as on the action board.
The Overview page of the Meridiaan board. Pages
The tabs at the bottom are pages. Each page is its own wall.
- Press the tab Sales · Delivery and customers at the bottom.
- See different tile kinds side by side: a gauge (dial), trend lines, a ranked list and an input tile where an owner types this month's value.
- Press Overview to go back.
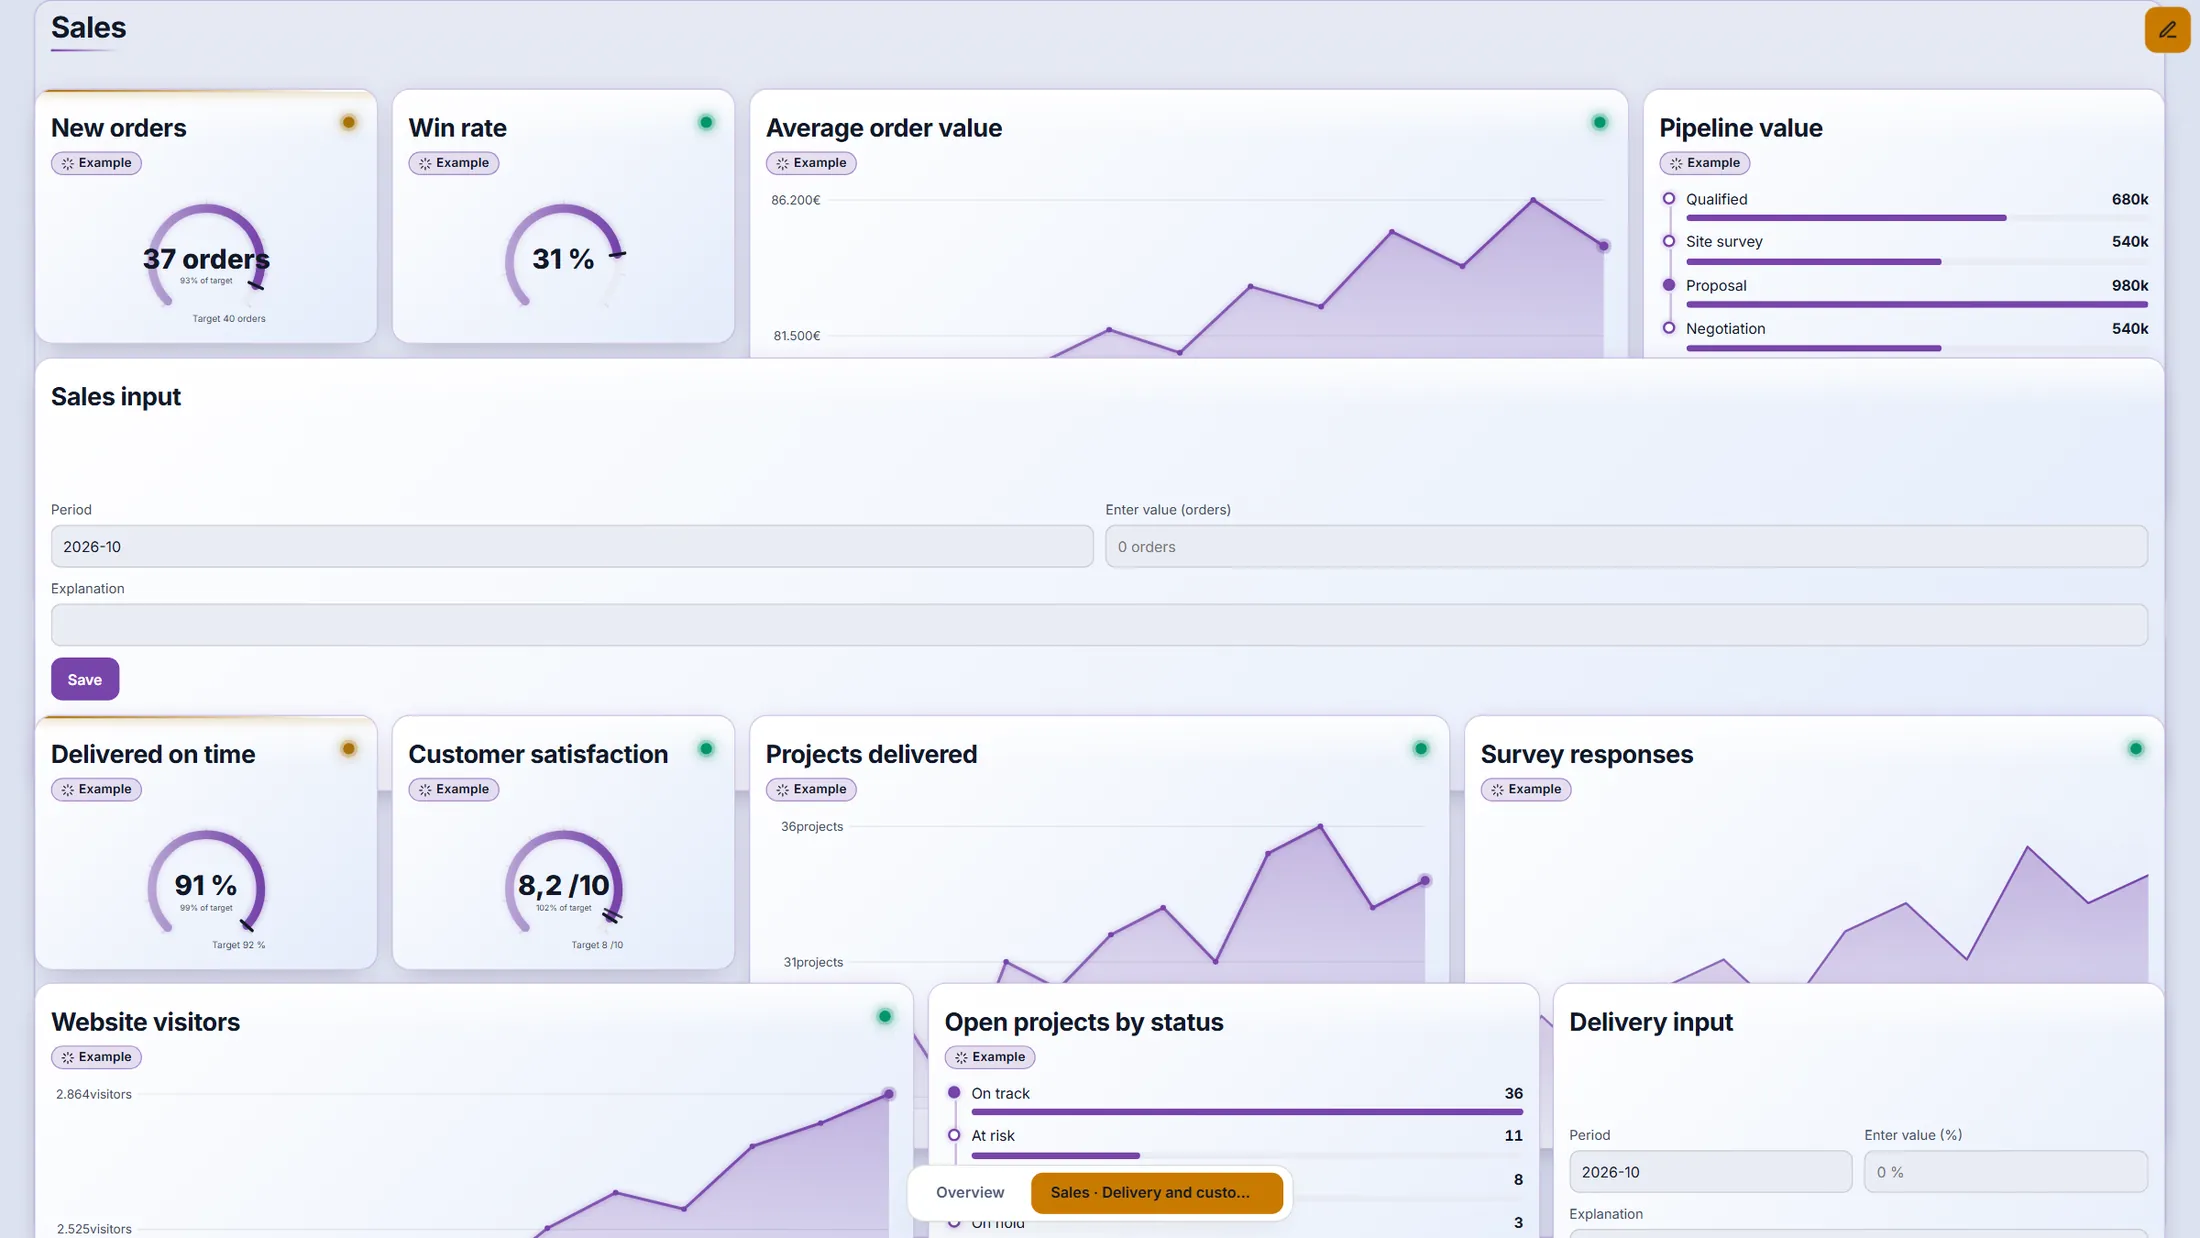
Page 2: many tile kinds on one wall. Point at a chart
Move the mouse over a line. A small card shows that month.
- Move the pointer over the line of Pipeline value . A card shows the month, the value and the change.
- Press the chart: a window lists every period, can switch between line and bars, exports to CSV and lets you go deeper.
- The small bar over the tile has four tools: refresh , ask a CrewMate about this panel , actions and owner and show details .
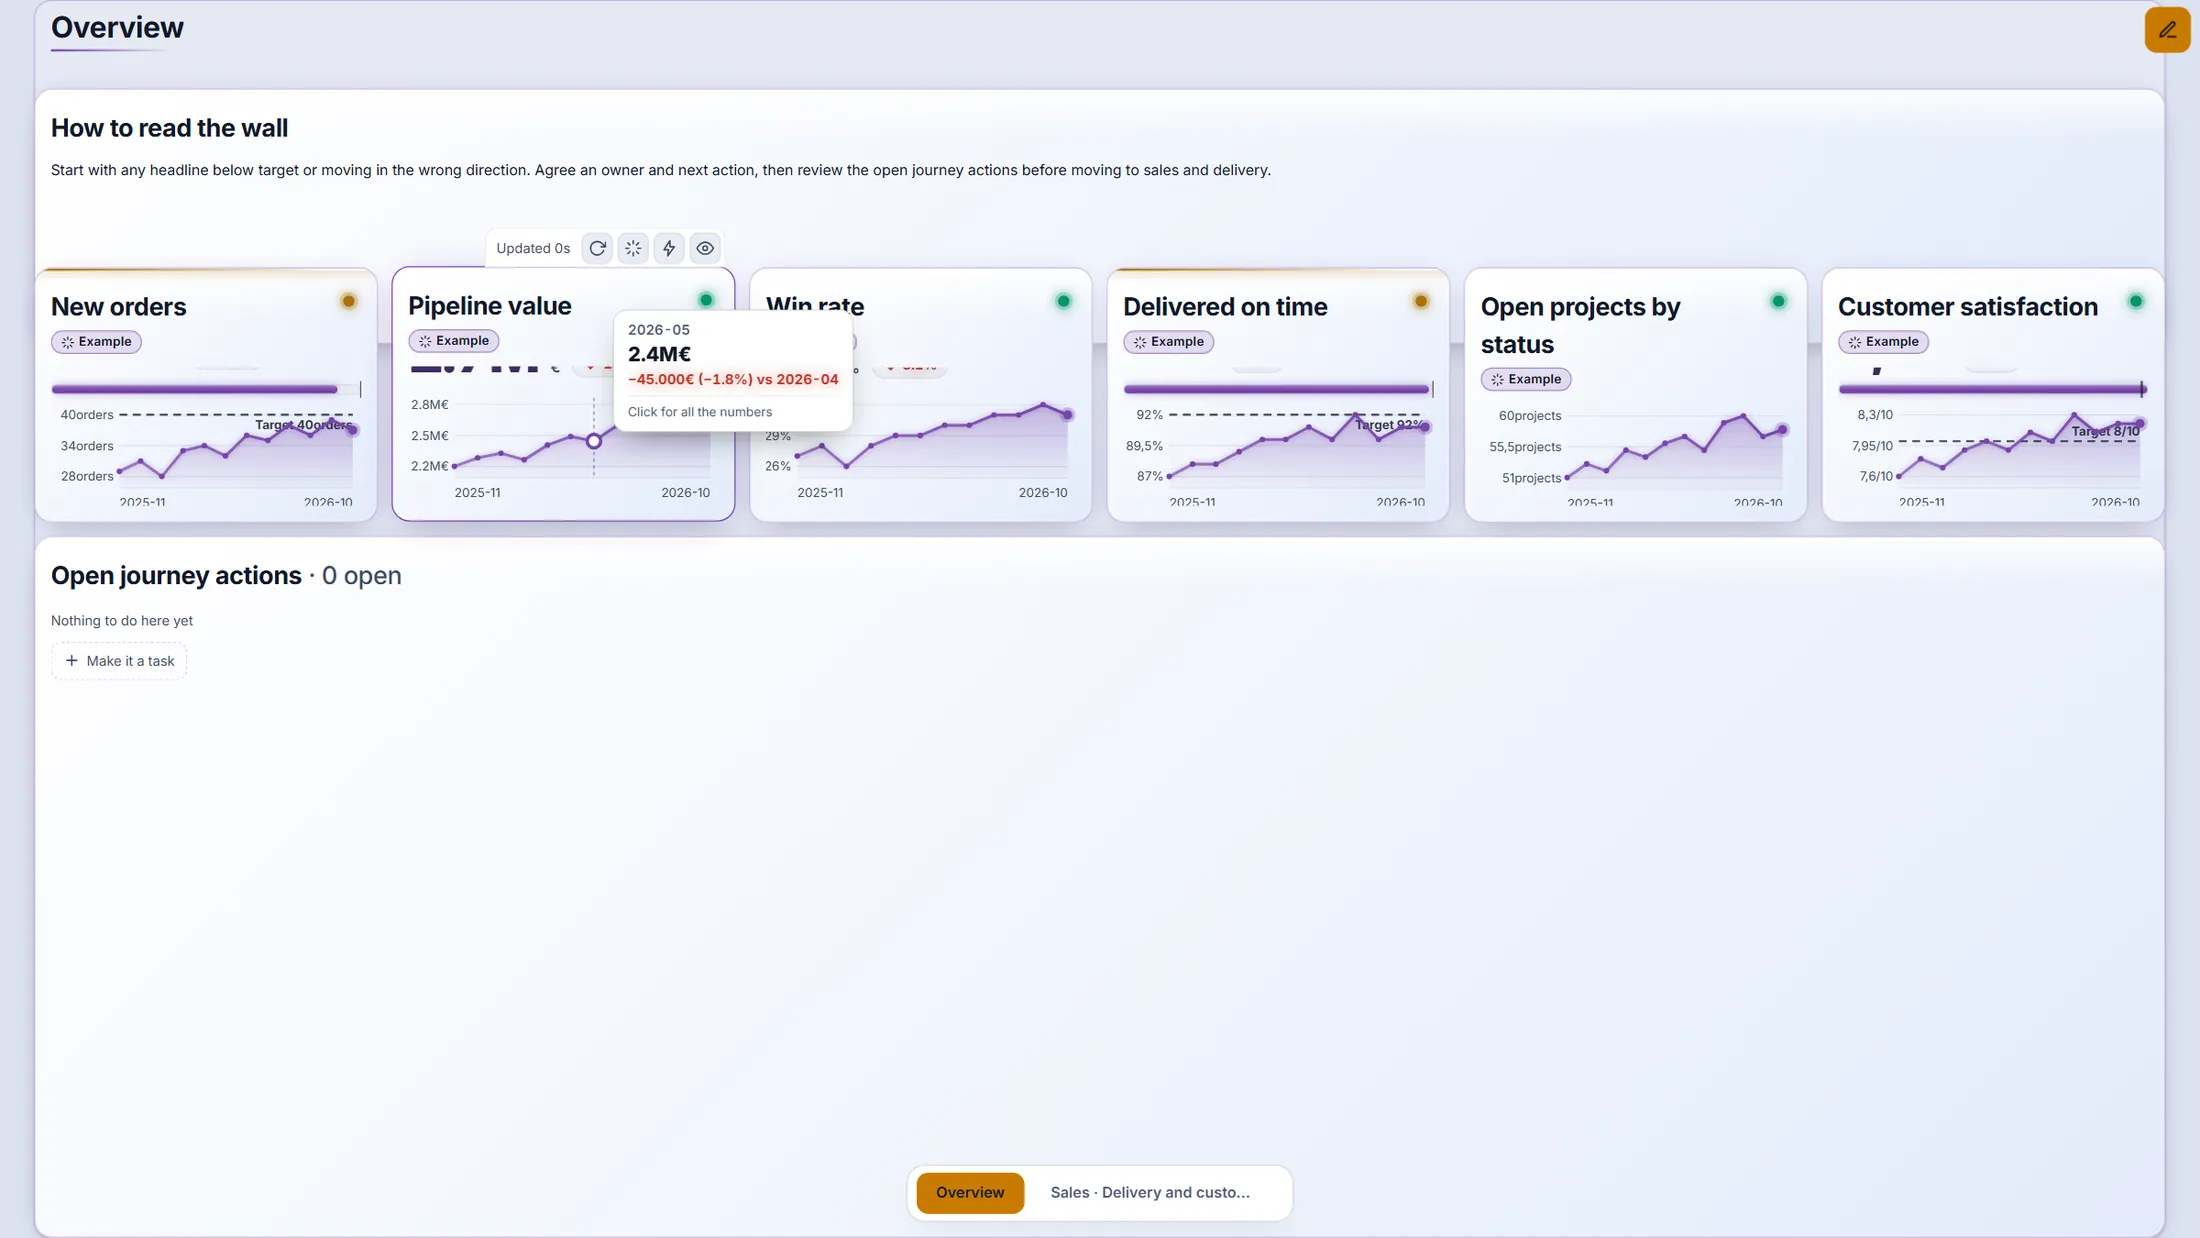
Hover: the value, the change - and "Click for all the numbers". When a number changes
The board updates by itself. You can also press refresh.
- Press the round arrow on a tile: only that tile reads its data again. The arrow in the header does it for the whole board.
- Typed values are never overwritten: every entry keeps its author, date and note, and the newest entry per period is the one shown.
- When somebody else changes the board or a value while you look, it arrives by itself. While you are editing, it waits in a small chip until you are done, so nothing jumps under your hand.
"Updated 0s" and the refresh arrow: you always see how fresh a tile is. Press the pencil to change things
Press the pencil. Buttons appear, and the board gets a grid.
- Press the pencil top right: Edit. A board is only edited by an organisation admin.
- Header: All actions opens every action of the journey by person, status and date; Goals to actions shows every goal, number and action of the organisation, connected.
- Bottom right: Add panel puts a new tile on the board, Undo and Redo walk through your changes, KPIs opens the list of measures.
- At the bottom the page tabs, and a + to add a page.
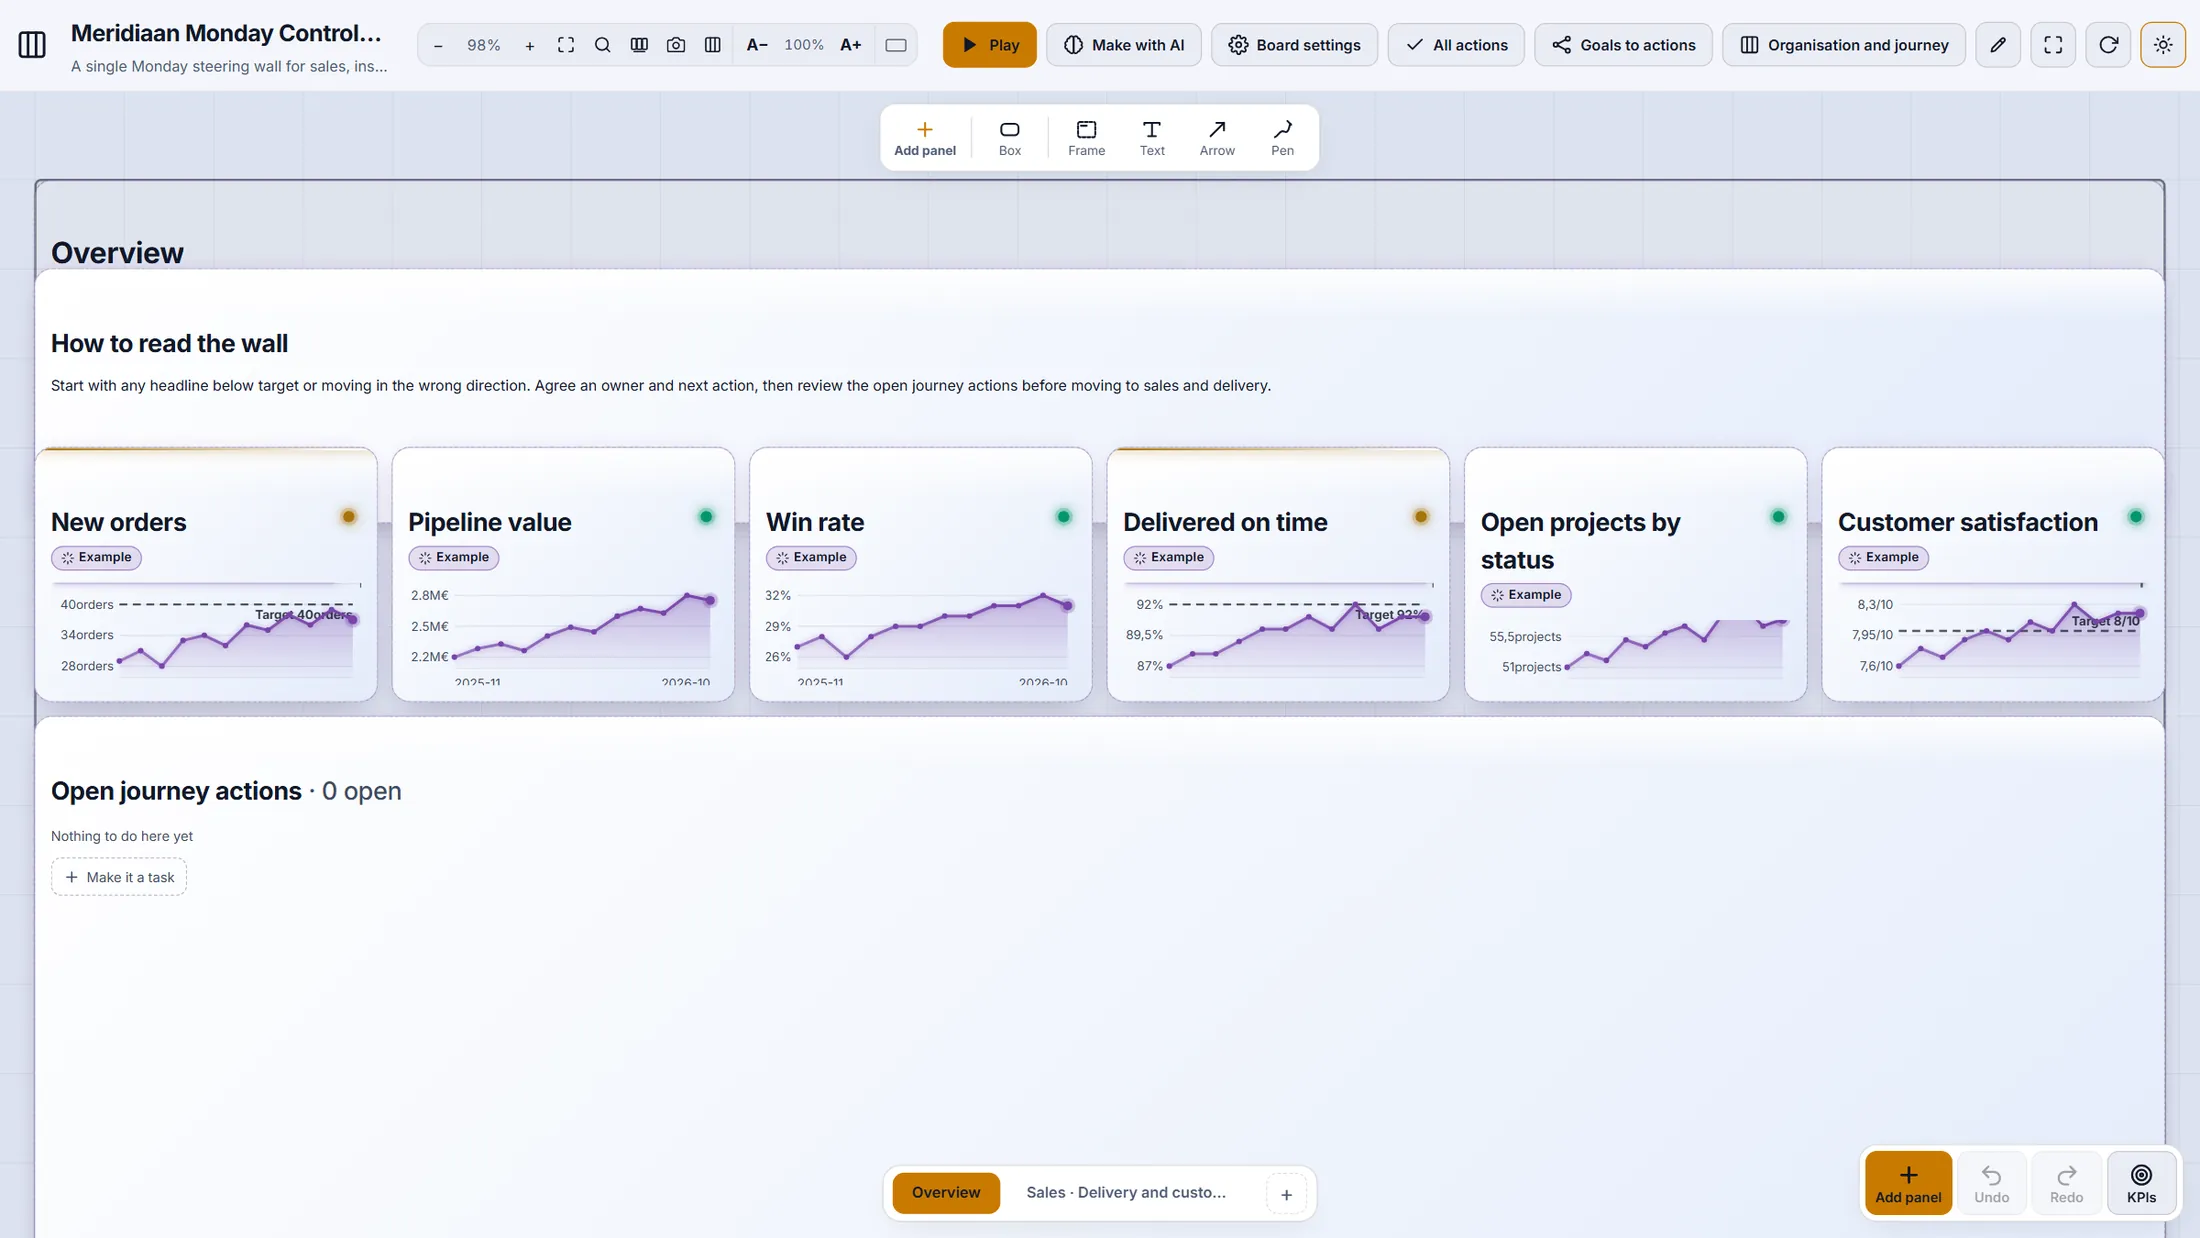
Edit mode on the same board. Pick a tile: numbers and charts
Press Add panel. A list of tile types opens, in groups.
- Press Add panel (bottom right, or in the shapes bar).
- Numbers & KPIs : KPI (one number with its target), Gauge (a dial), Input (type this month's value), Signal (every measure that is behind), Simulation (knobs to turn, and what they change).
- Charts & tables : Trend, Table, List (ranked, with bars), Roadmap (a timed plan you drag on the tile), Map (a world map), Line with target, and more such as Status matrix, Heatmap, Burn-up and Run chart (SPC).
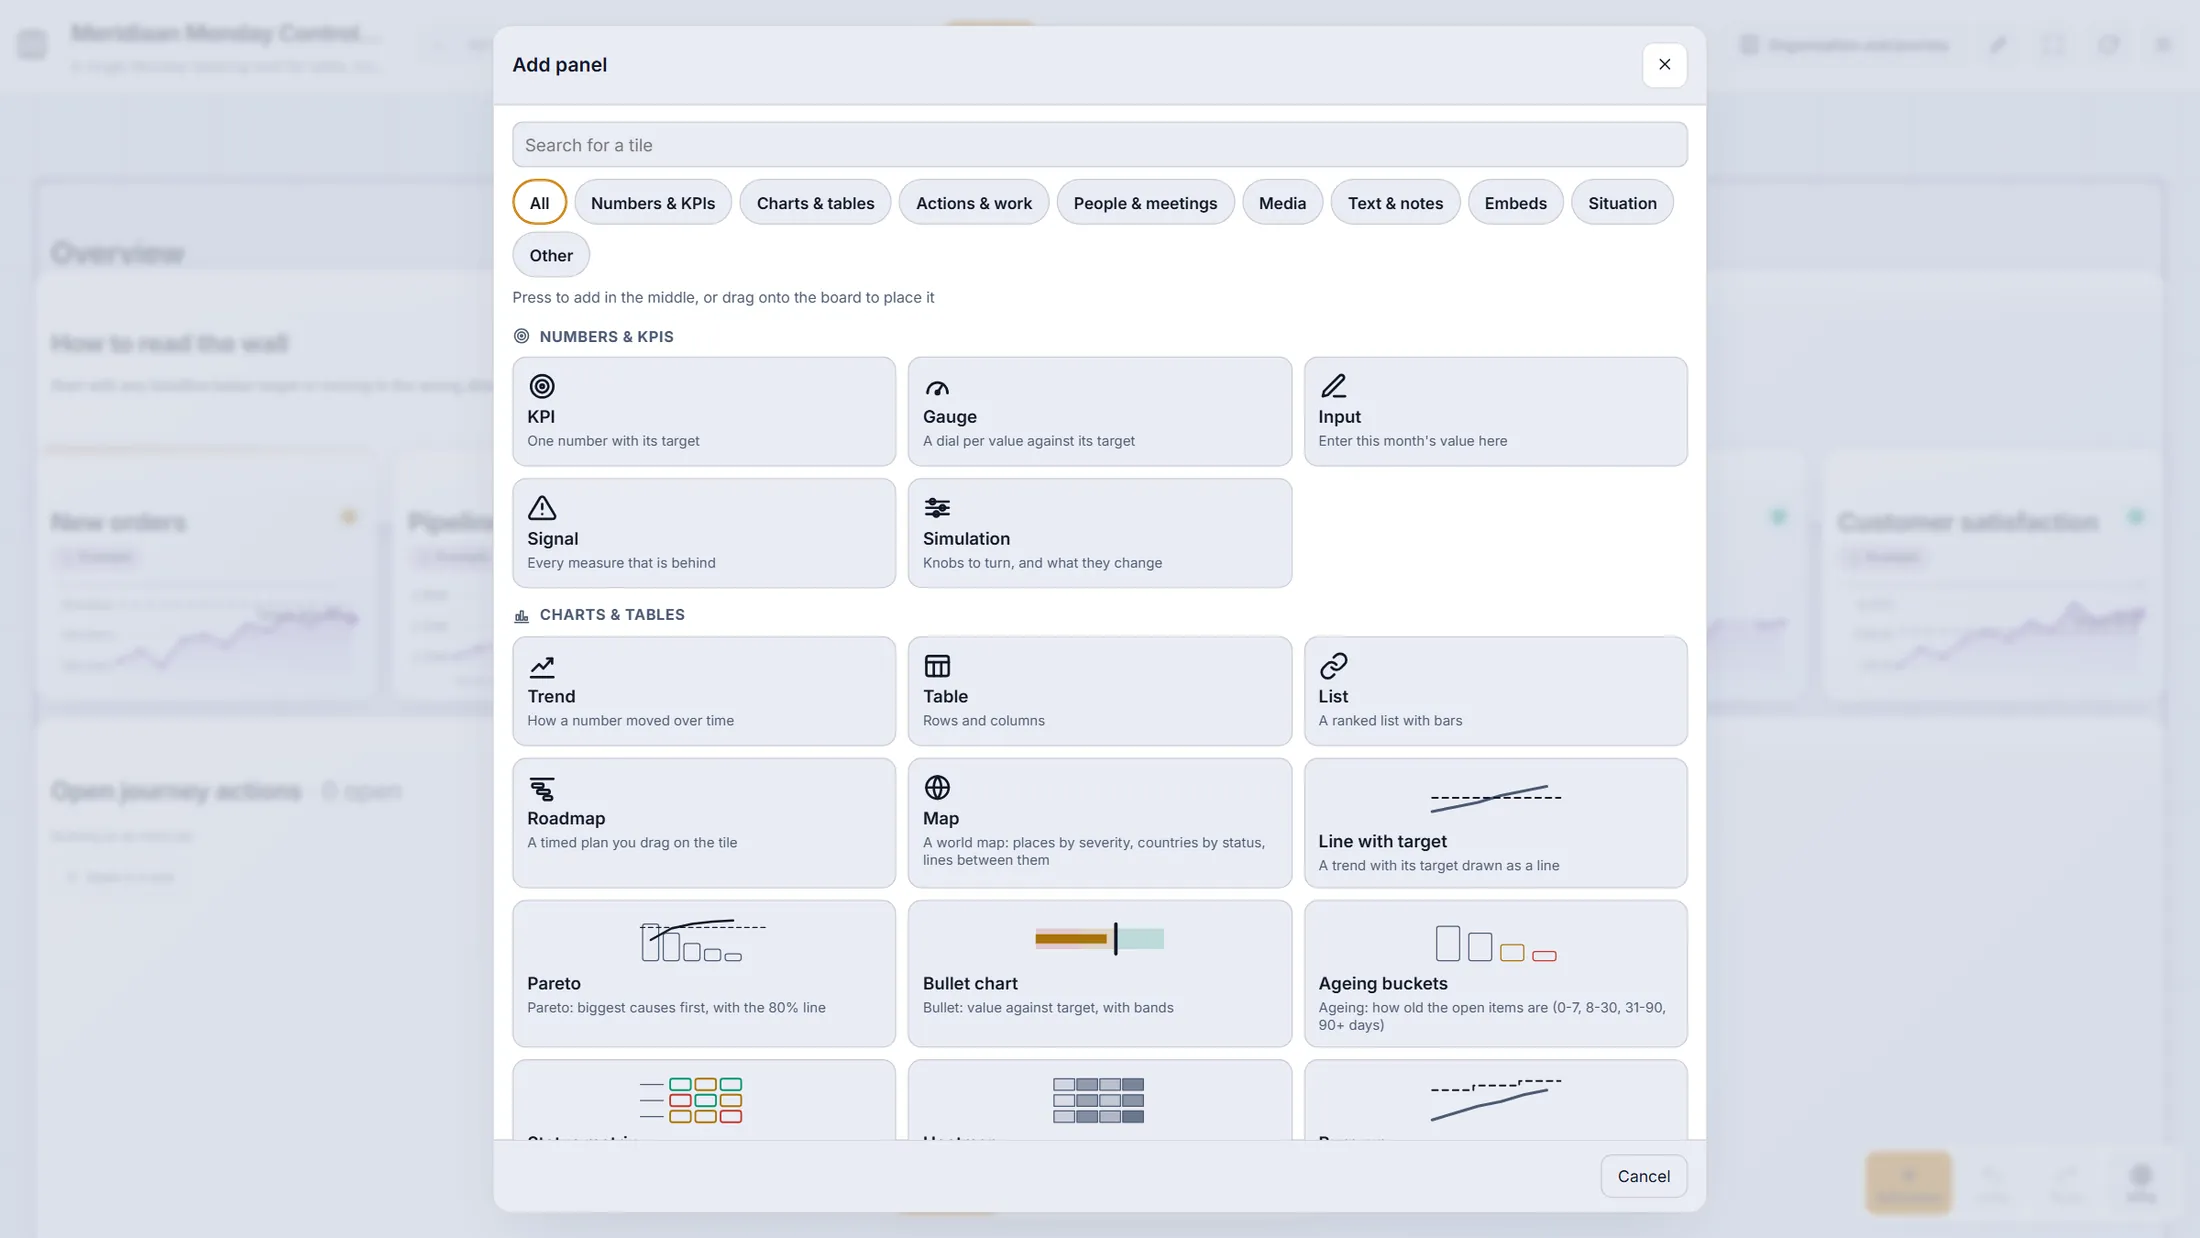
Group one and two of the tile list. Pick a tile: work, people and media
The journey itself can sit on the wall: actions, agenda, chats, files, a project.
- Actions & work : Actions (buttons: a link, a board, a refresh), Project (a project from /project, live), Scrum board, Time booked (hours this week, per person).
- People & meetings : Teams meeting, Evidence (stories and quotes from a collection), Journey agenda (the month and its meetings), Room agenda (who booked this room), CrewMate (an avatar that answers about the board), Chats (last messages, with a box to answer).
- Media : Image, Video (a video, a stream or a live event), MediaStory (playing) and Files (one Community Files folder).
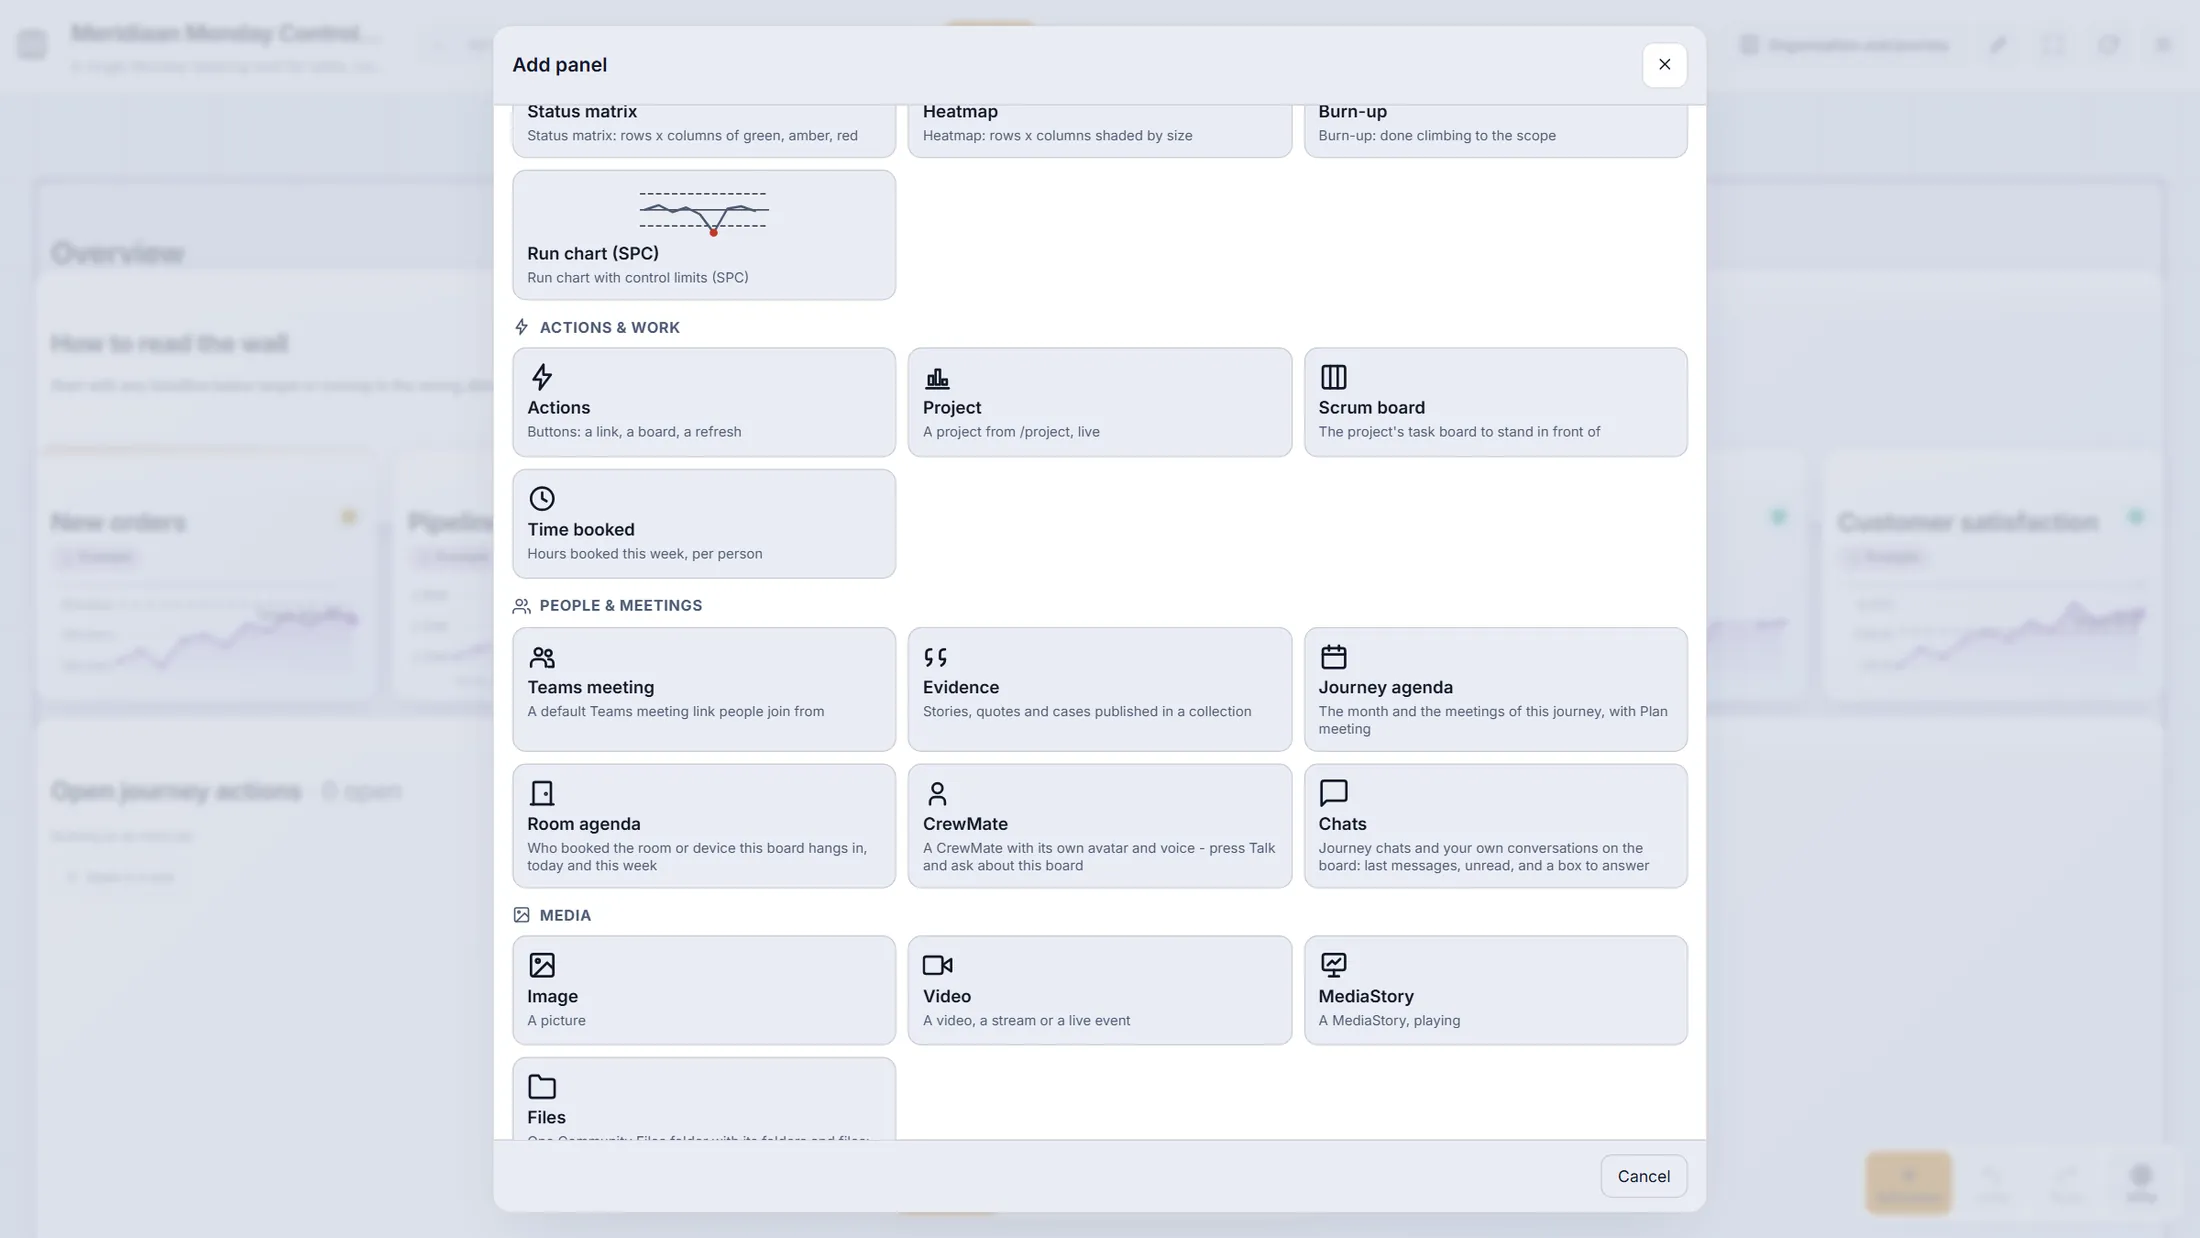
Tiles that show the work of the journey: actions, agenda, chats, files, video. Pick a tile: text, embeds and situation
The last groups: notes, other people's pages, and a live picture of what is going on.
- Text & notes : Text (a note for the room), Links, Mind map (worked on the tile itself), Infinite canvas (draw, notes, pictures).
- Embeds : Embed (somebody else's page, framed - for example Power BI, YouTube, Vimeo) and HTML app (a small page from Community Files that saves its own data). Only allowed hosts can be embedded.
- Situation : Alerts (incidents with severity, place and time - acknowledge and close them here), Status board (named statuses with a coloured word and a trend arrow), Ticker (a scrolling LATEST line) and News feed (RSS or Atom, also secured ones).
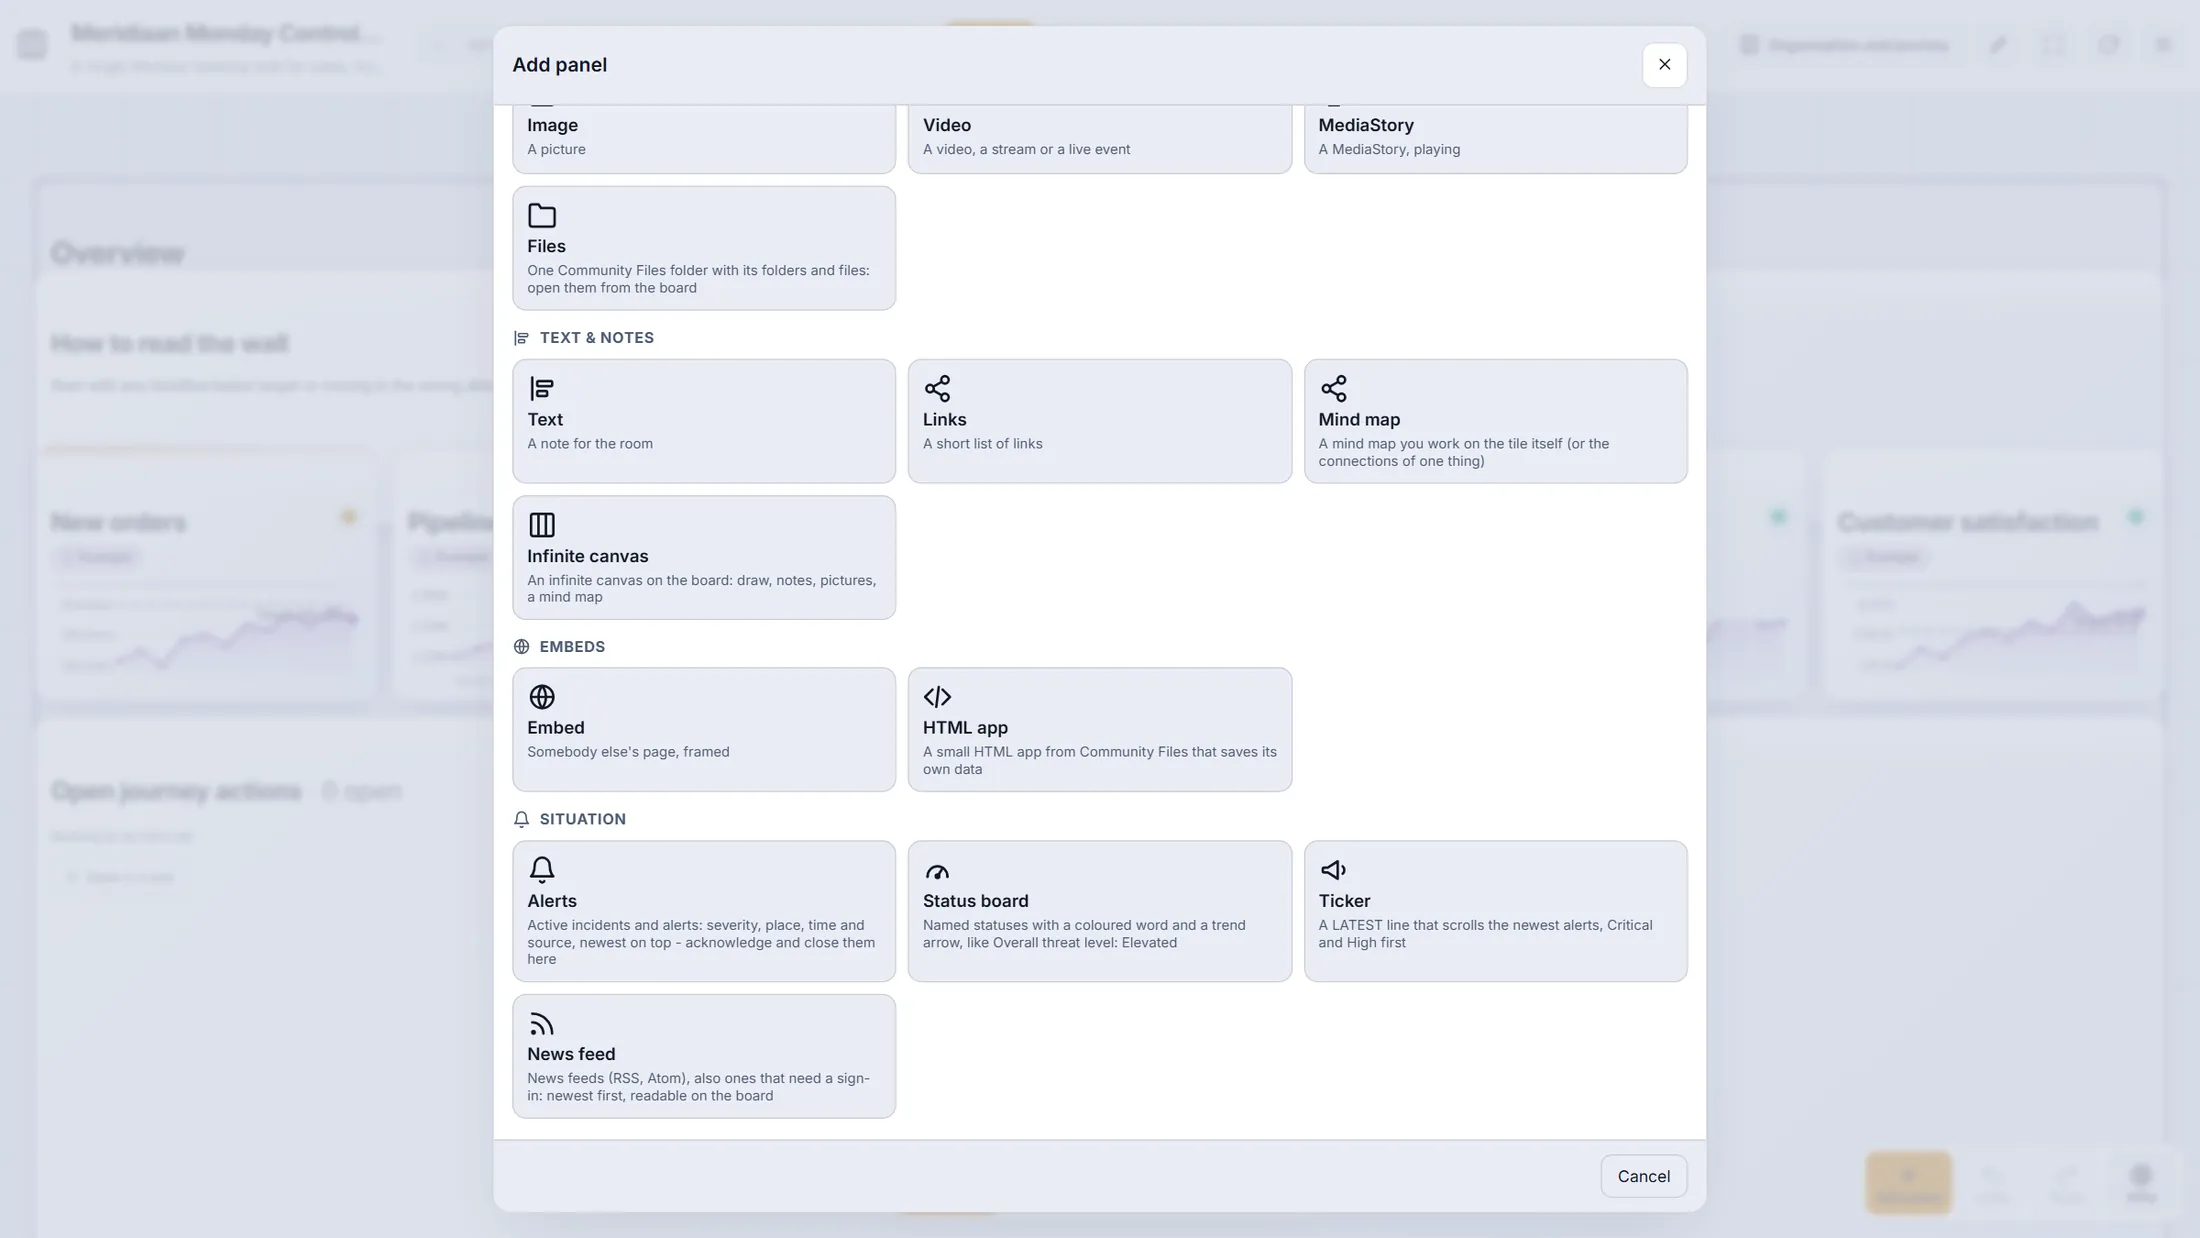
Notes, embeds and the situation tiles. Move, draw, overlap
A board is not a rigid grid. Move tiles, draw boxes and arrows, and lay tiles over each other.
- Drag a tile by its top bar to move it. Drag its corner to resize. A tile may lie over another one: the order in the list decides which is on top.
- In the shapes bar press Box. The hint says: Drag on the board to draw a Box - or click to place it. Esc puts it away.
- Frame draws a frame the other tiles sit in, Text free words, Arrow a line between tiles, Pen a free line. Double-click a shape to type words in it.
- The board can grow: drop a tile past the right edge and it gets wider, up to 128 columns.
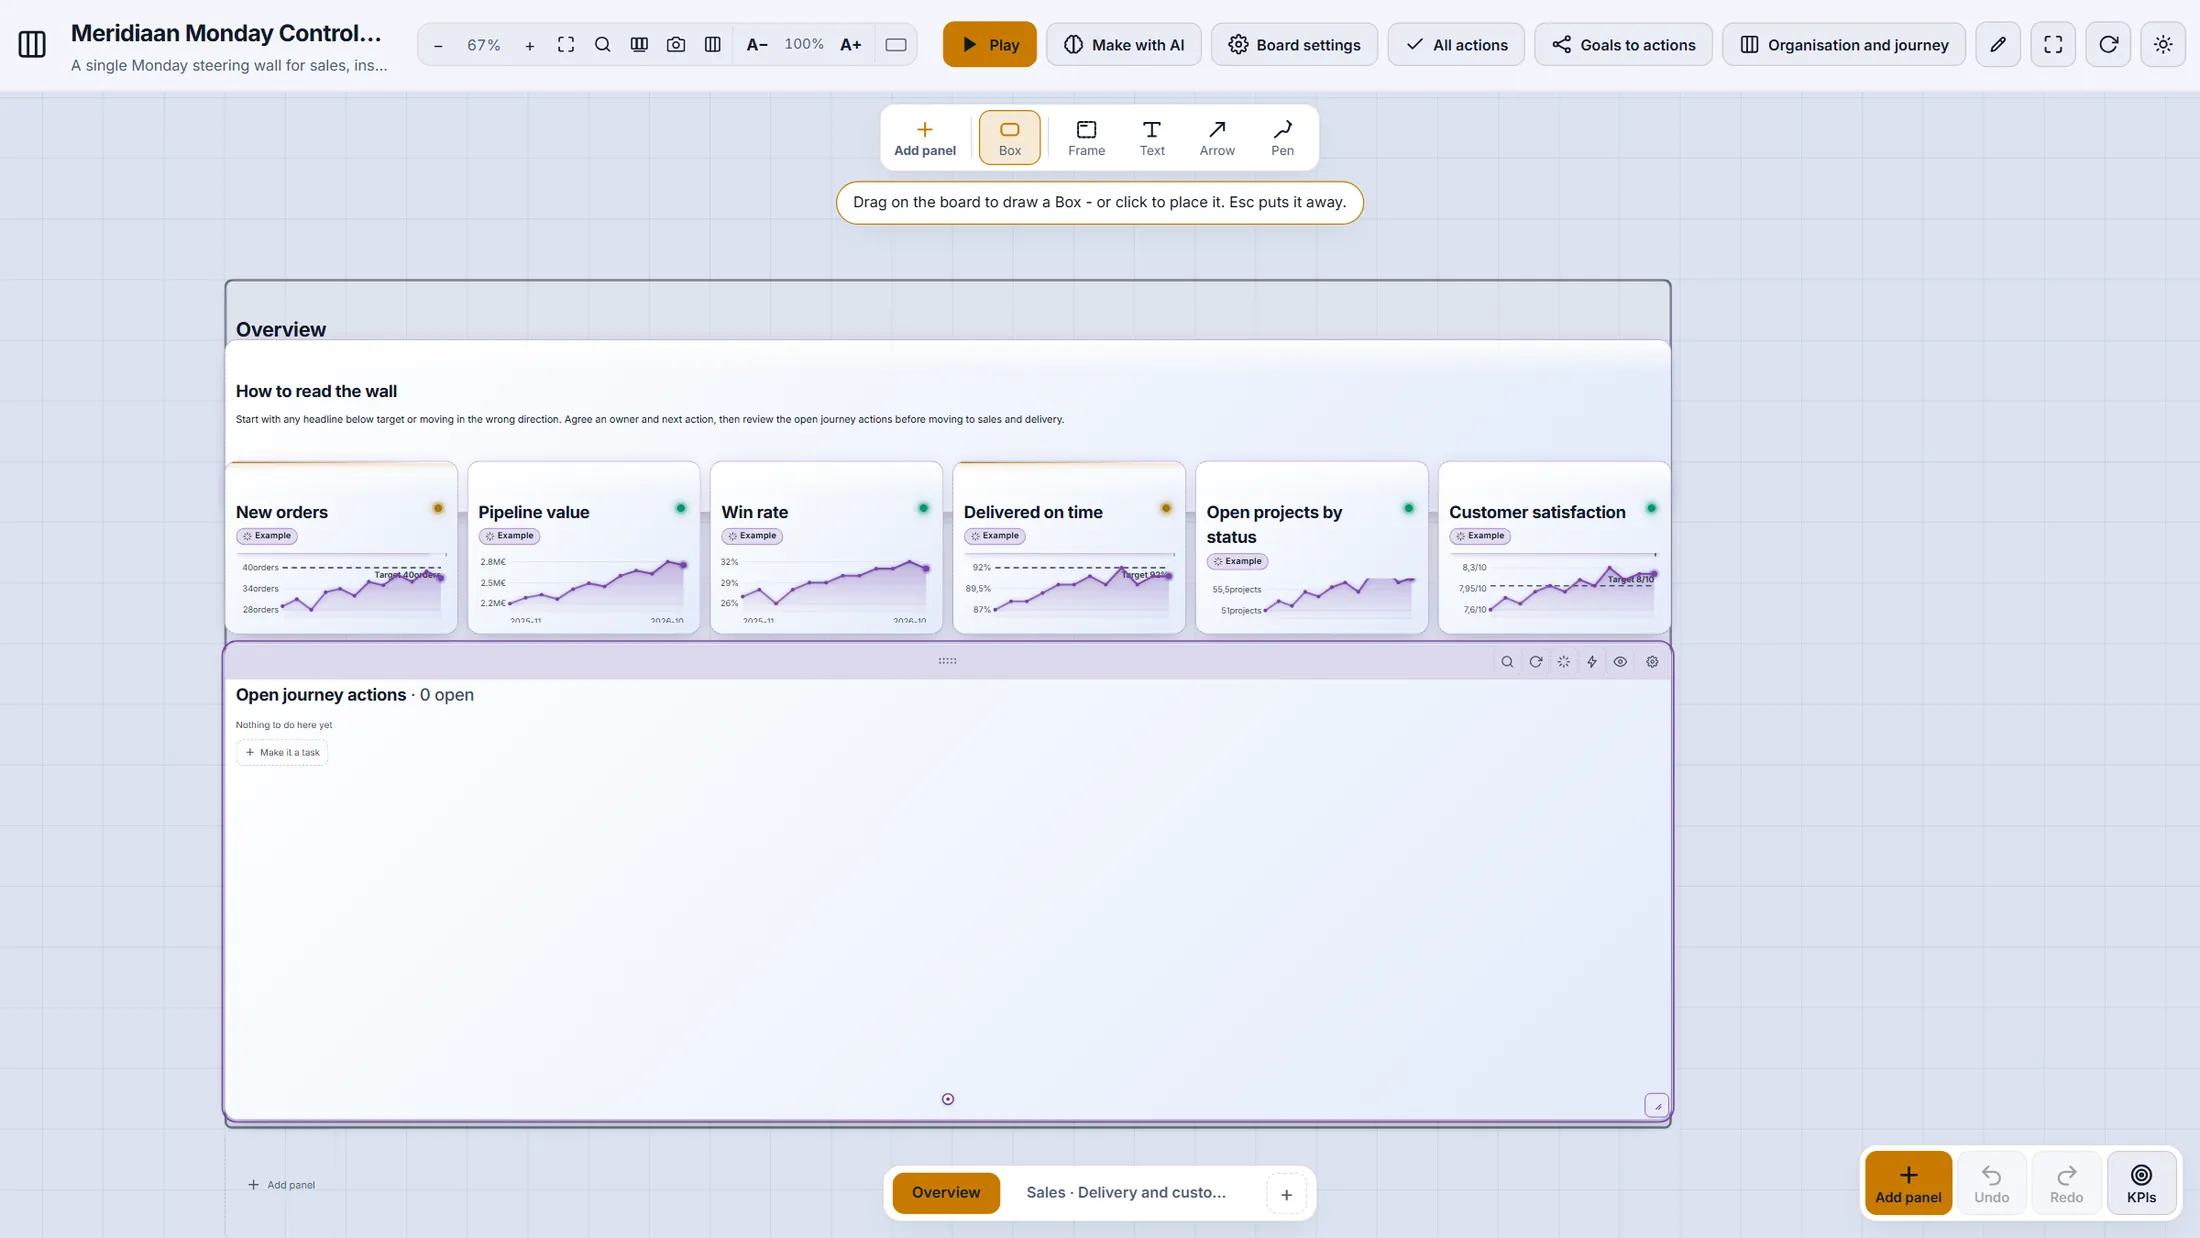
Box is armed; the tile under the pointer shows its own tools. Three ways to feed a tile
Open a tile's settings. At the top you choose where its numbers come from.
- In edit mode point at a tile and press its gear . The window Panel settings opens.
- A KPI: the tile follows a measure that holds the target and the entered values. Pick one from the list, press New KPI to make one right here, or Enter value to type a value now.
- A data connection: the tile reads from a web service, a file or live data (steps 14-17).
- Values typed in here: the numbers live in the tile itself (step 18).
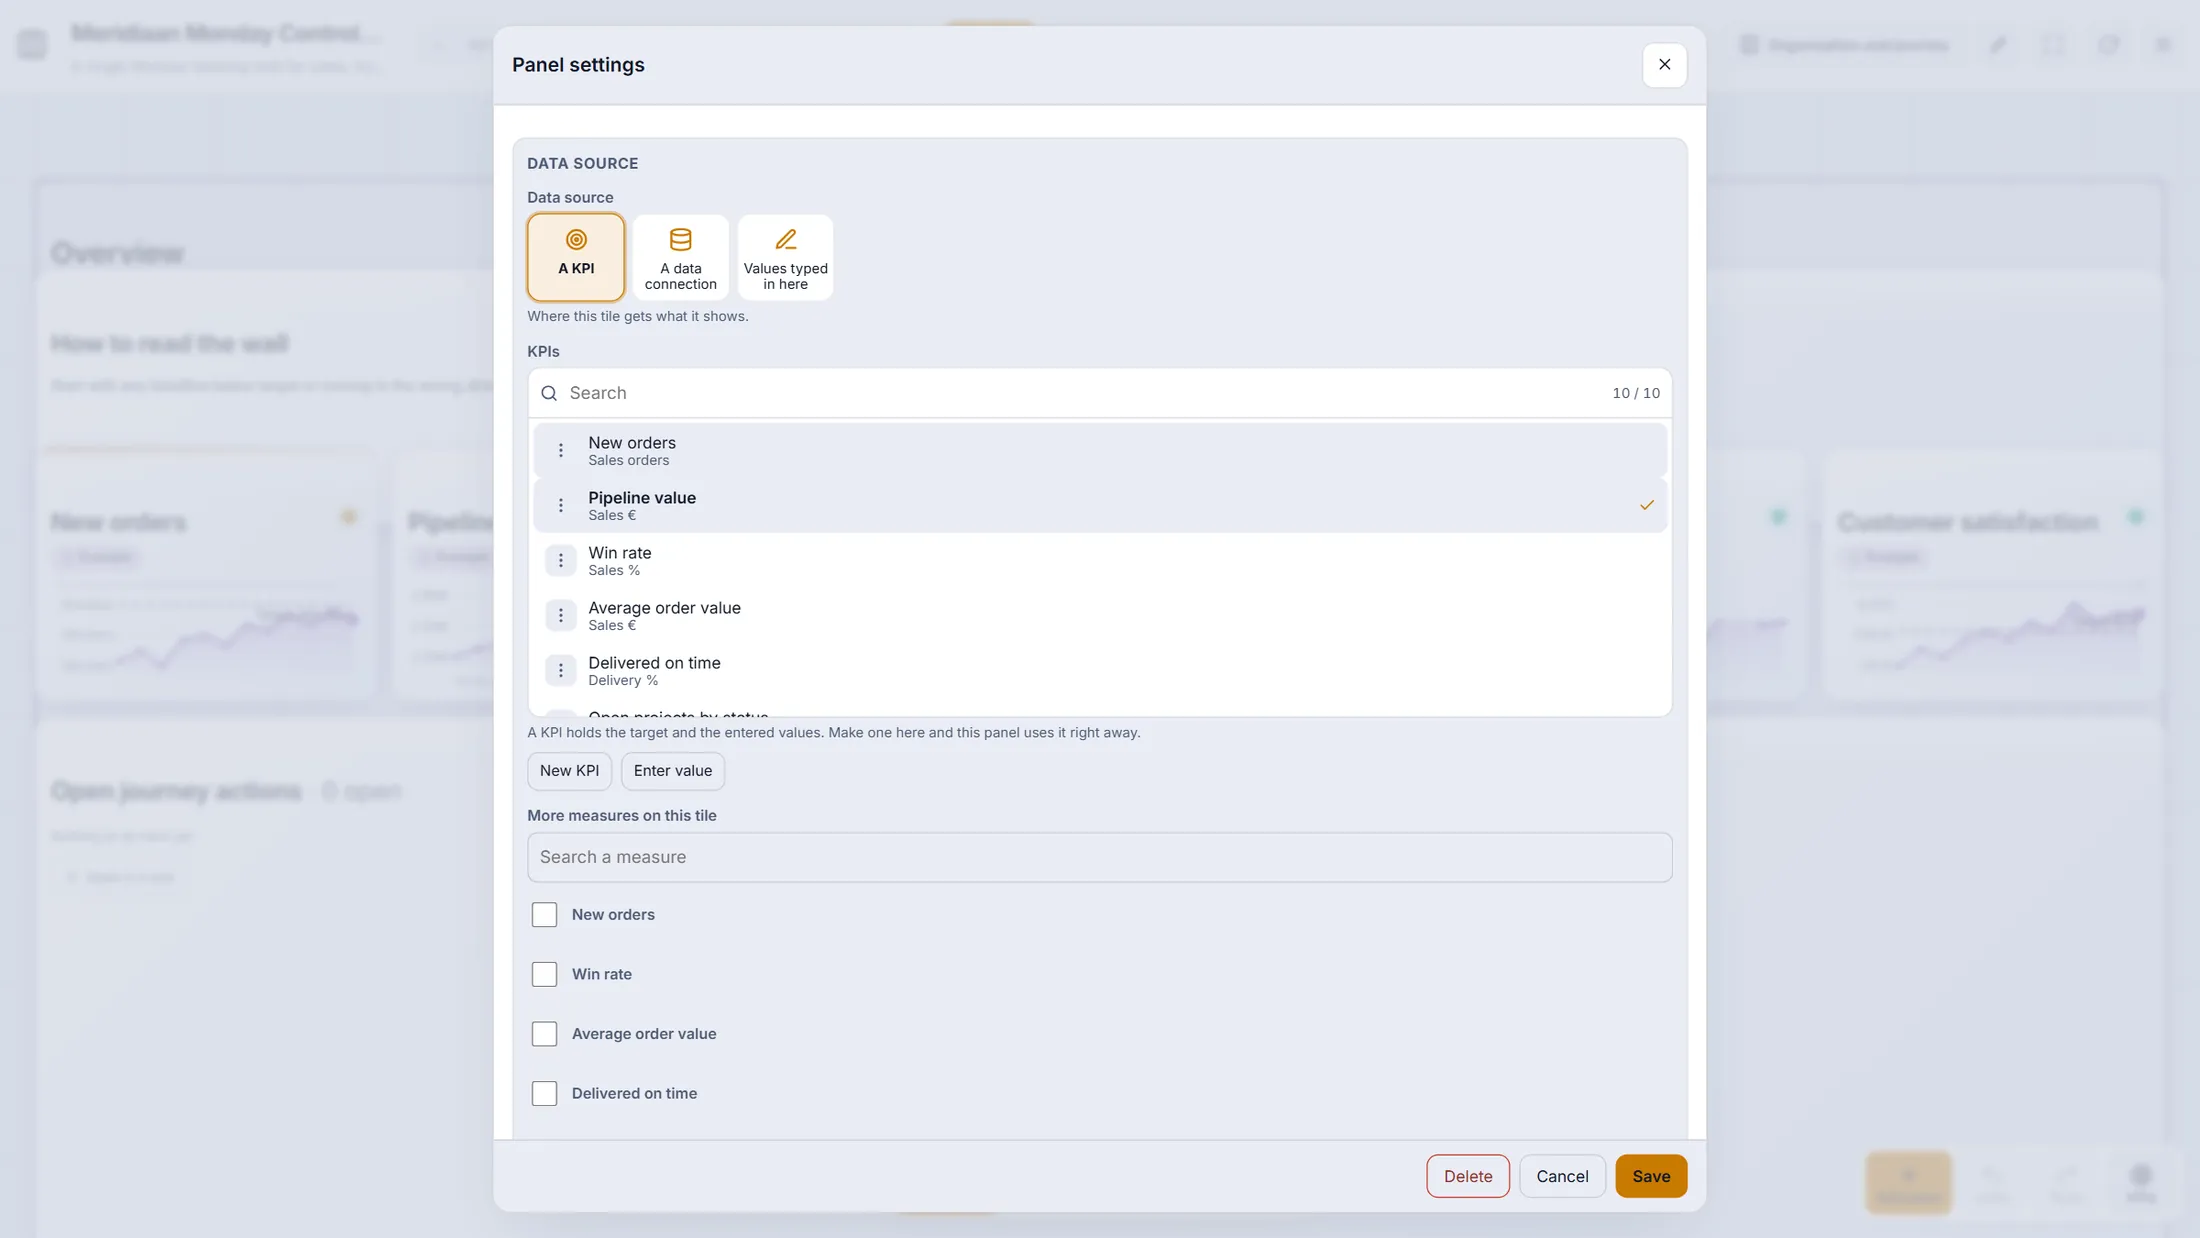
The three big choices at the top of a tile's settings. All your measures in one list
Press KPIs (bottom right). Every measure of the organisation is a row.
- Press KPIs at the bottom right. A table lists every measure with Title, Pillar, Owner, Target, Updated .
- The first button of a row connects the measure to actions and other things: a number wired to an action is wired to it everywhere. + adds a value, the pencil edits, the bin deletes.
- New KPI makes a measure; Refresh reads the list again.
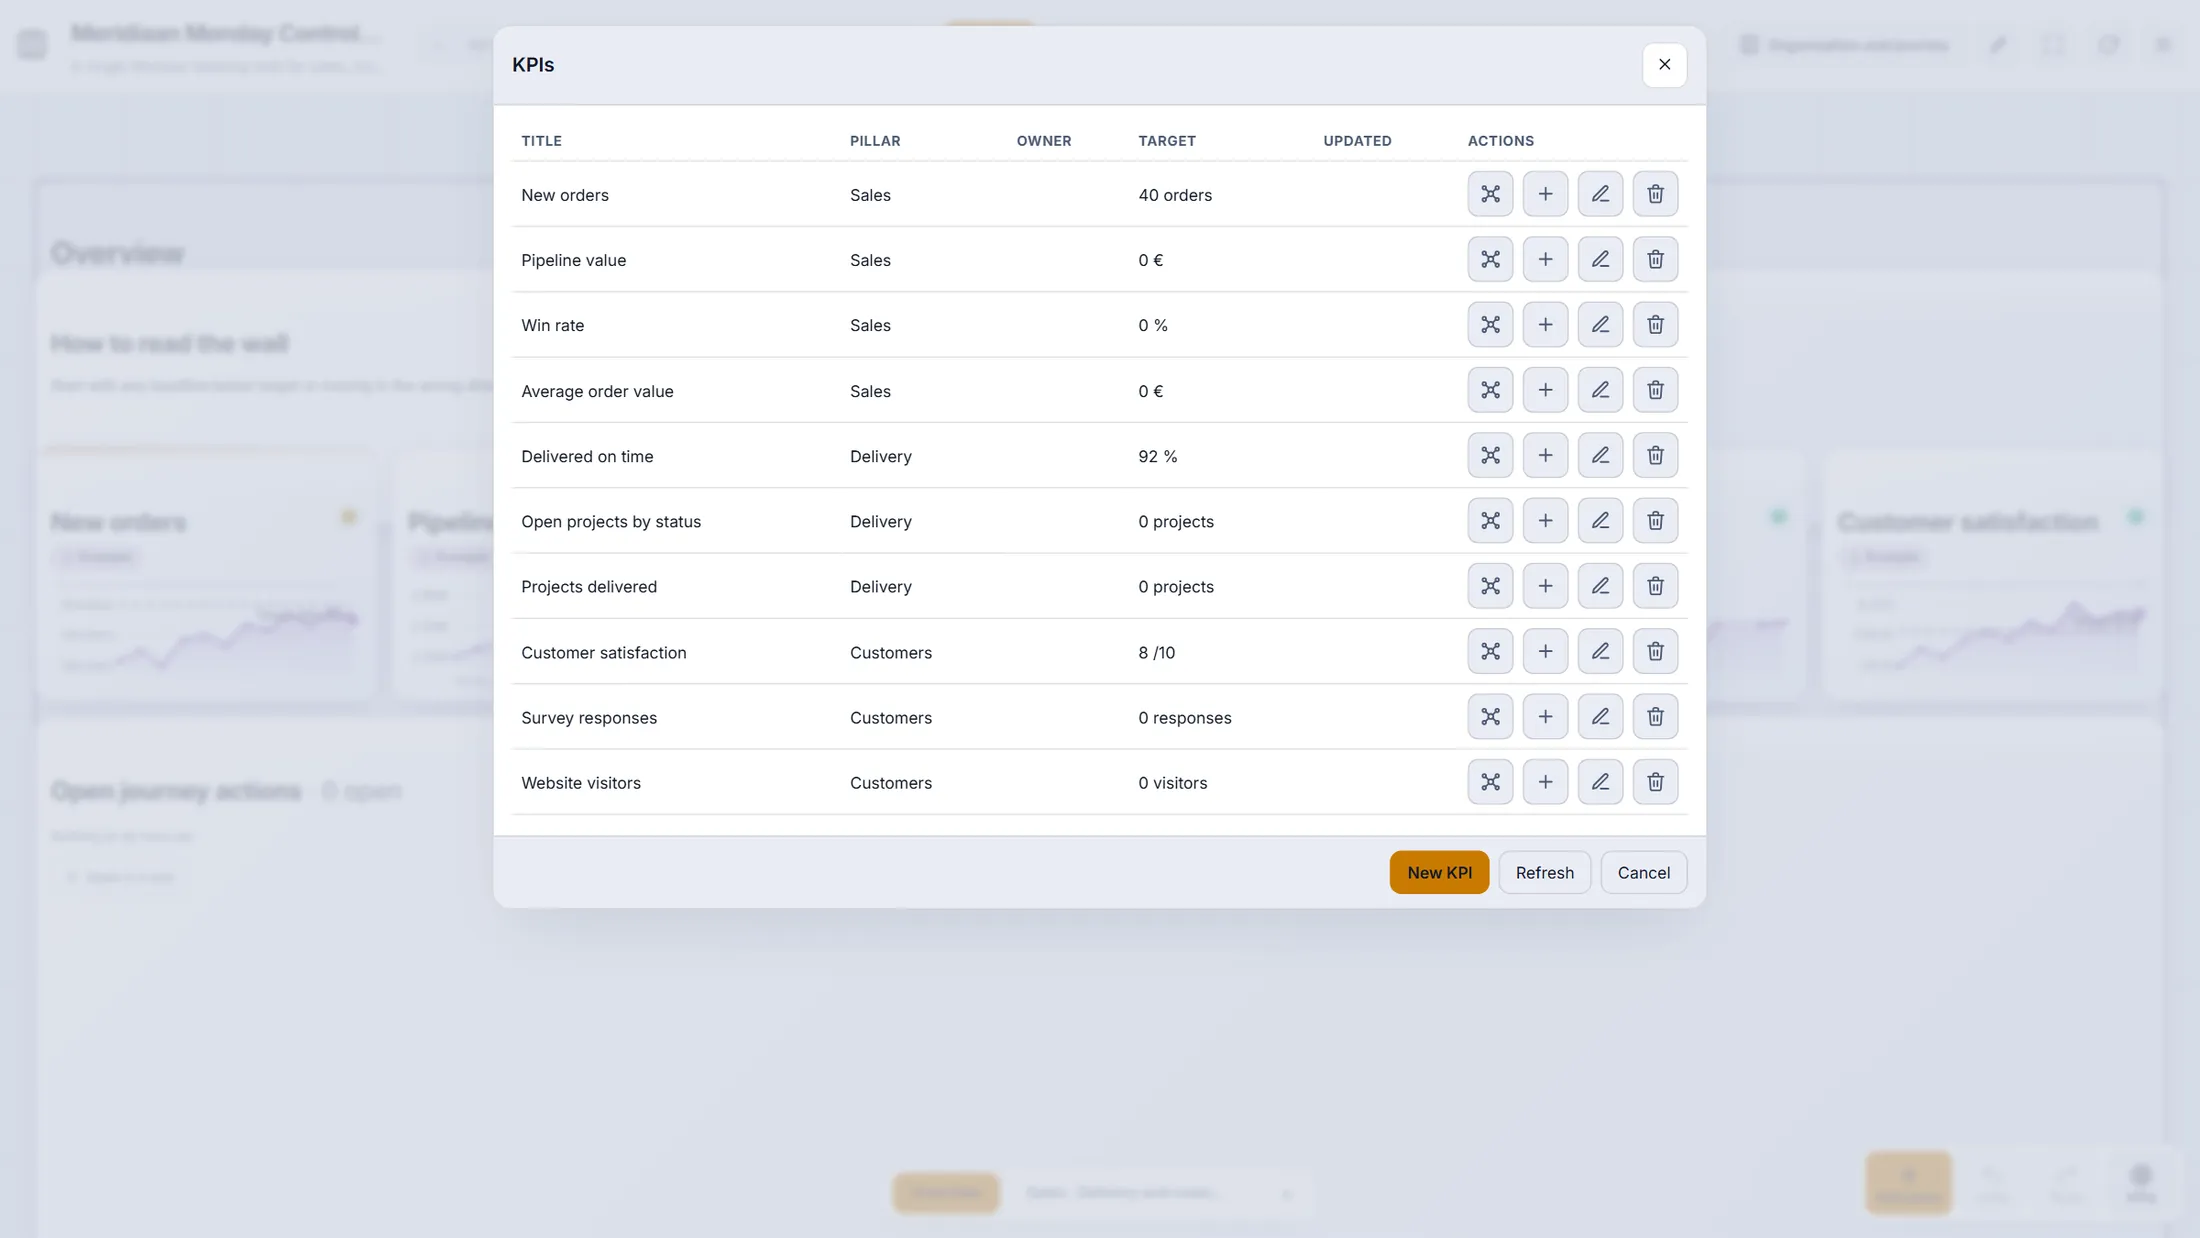
The measures of the Meridiaan board. One measure, in detail
Press the pencil on a row. You see everything that defines the number.
- Set up / down : Higher is better (orders) or Lower is better (complaints).
- Choose the Period : Every month, Every quarter or Every year - how often a value is entered - and the Target with its period.
- Slightly behind % (here 90) is the share of the target under which the tile turns amber instead of green.
- Owner : pick a person from the list. At Data source choose how the numbers arrive (next step).
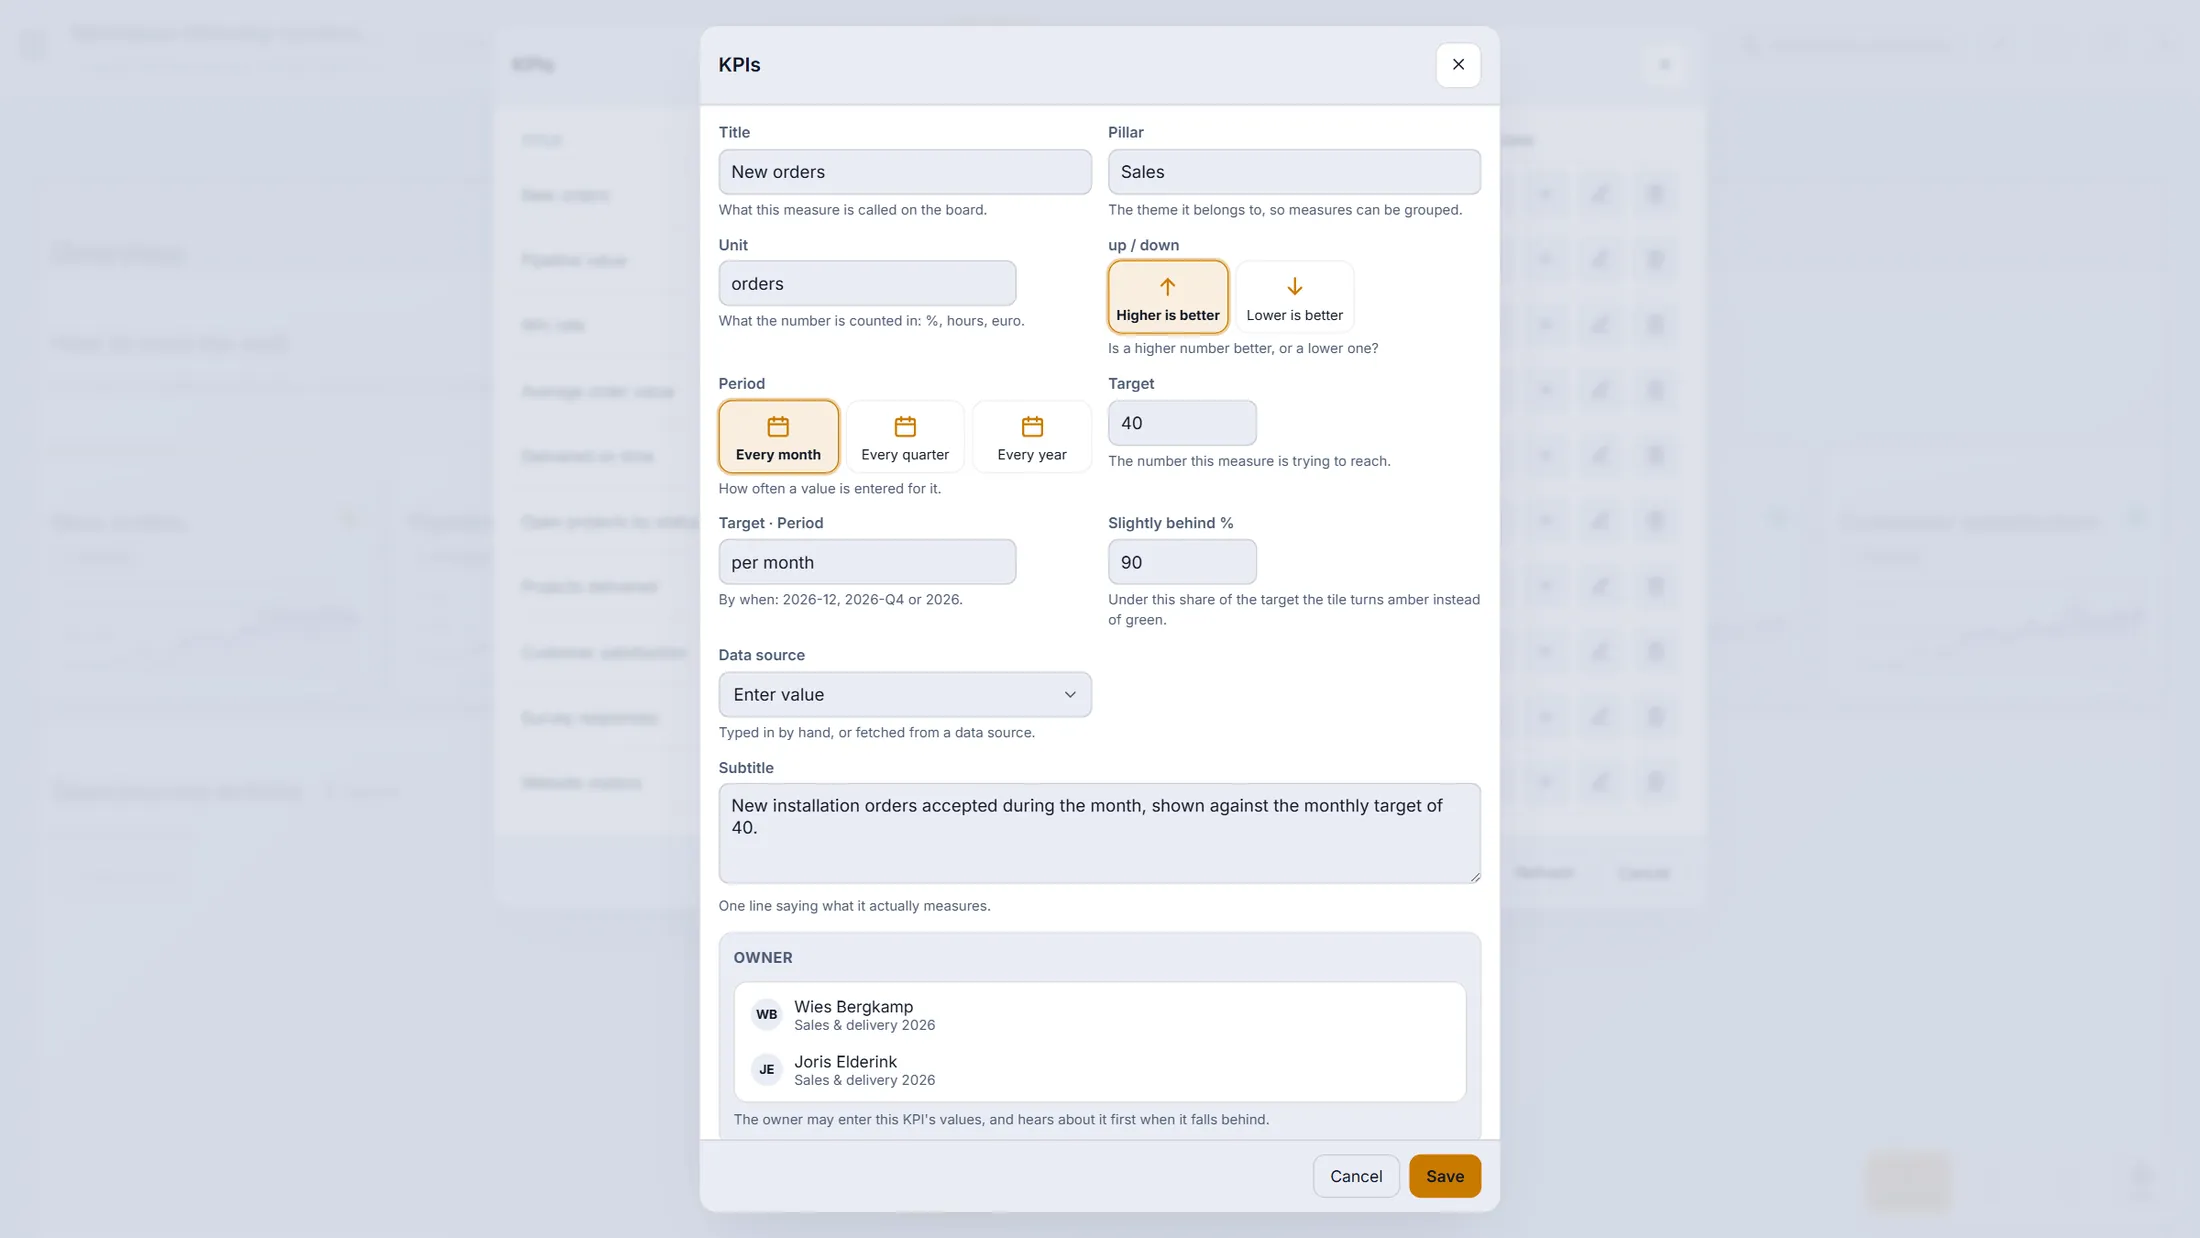
One KPI: everything that defines the number. Enter, fetch or count
Open the Data source list of a KPI. Three choices.
- Enter value: the owner (or an admin) types the value per period, with a note and documents. Every entry is kept - nothing is overwritten.
- Data source: pick a data connection (steps 14-17). The value is fetched, filtered and summed for you.
- Counted by the platform: active and returning people, members and new members, interactions (posts, comments, chats - no reactions), people per organisation role, survey responses, average and NPS, published stories. A counted KPI refuses typed values.
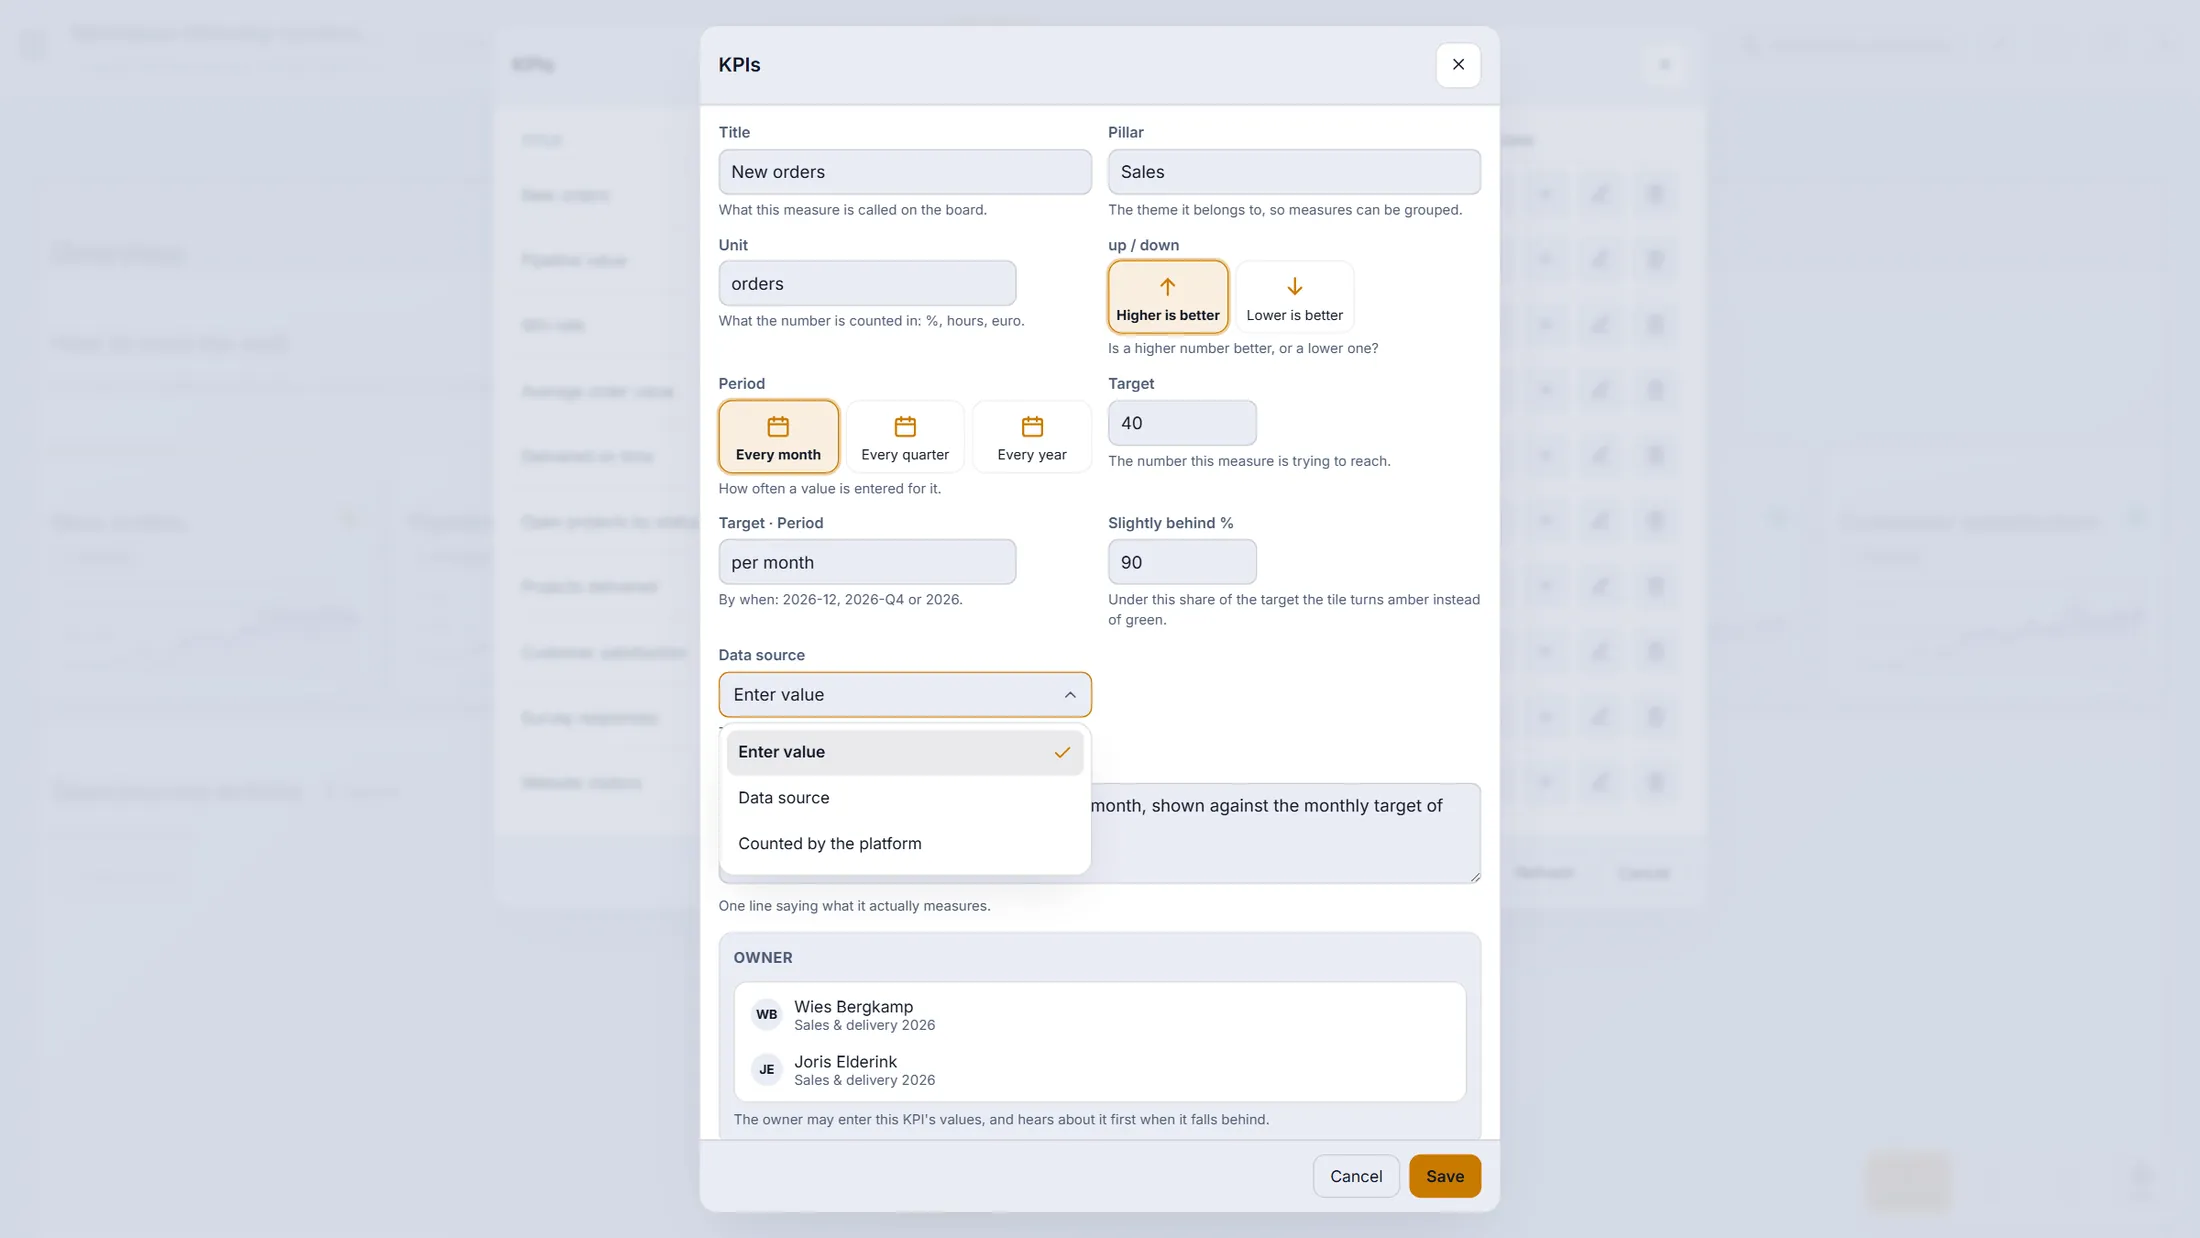
The own dropdown of CoVince: three ways to get a value. A data connection
Choose A data connection. You see the connections of your organisation.
- Press A data connection. The list shows each connection with its address: here an orders export (CSV), a Google Sheet and a web service.
- Pick one. Under Series press Series + to say which column or value becomes a line, and filter, group or sum it (count, sum, average, minimum, maximum, percentage).
- Set Which way is good and the amber point under it, as with a KPI.
- Not in the list? Press New data connection (next step).
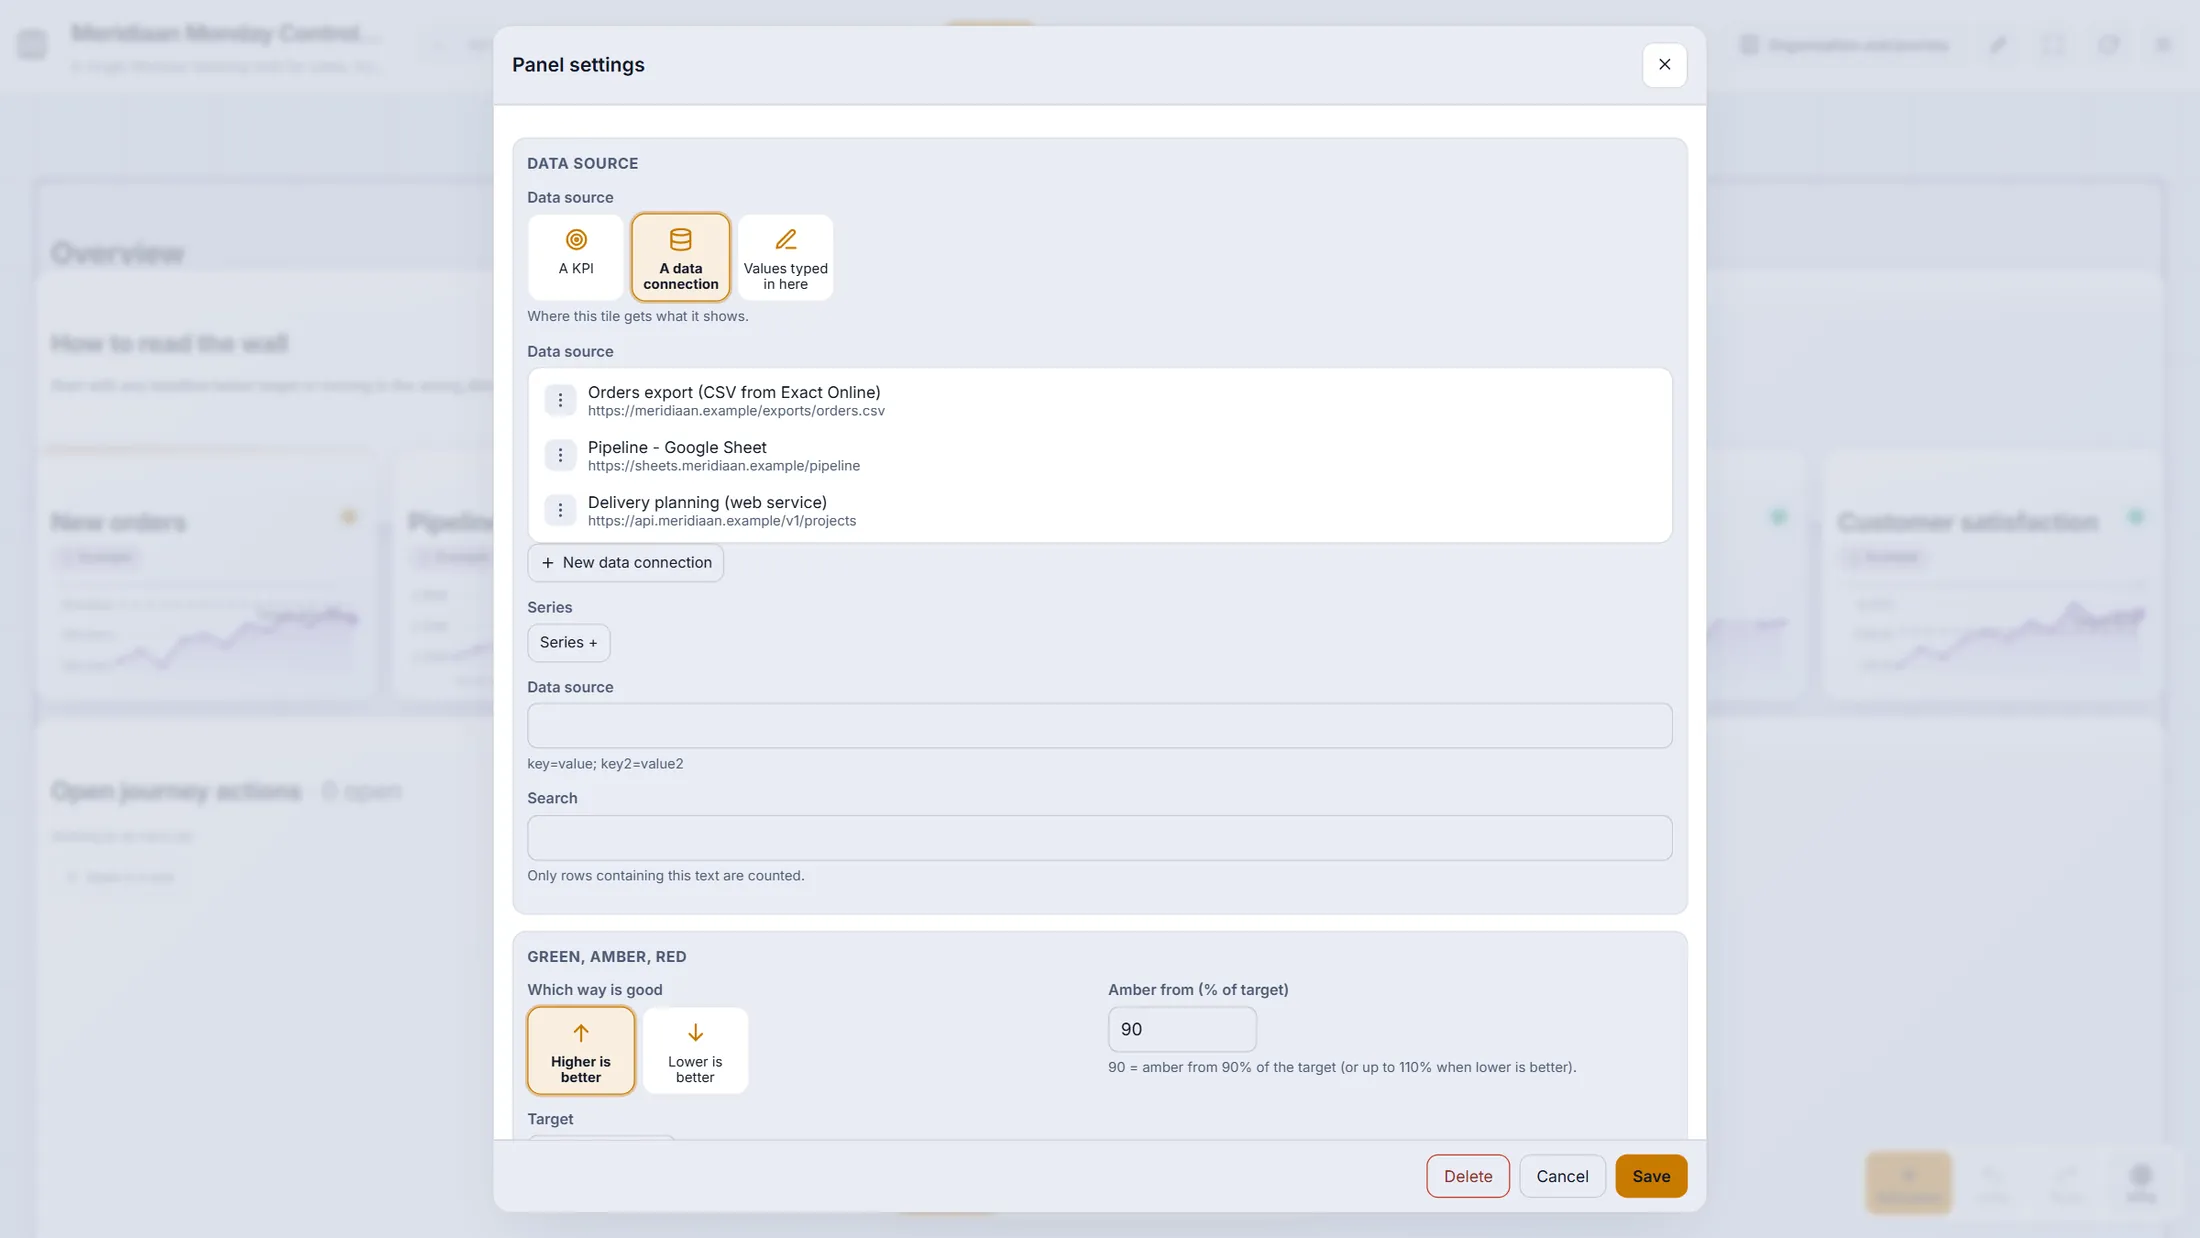
Three connections of Meridiaan B.V.: a CSV export, a Google Sheet and a web service. A new connection: where does it belong?
A small window with three steps. First you say who may see it.
- Press New data connection. A window opens with a progress bar: Step 1 of 3 .
- Search or pick a journey (the chosen one has a tick) or The whole organisation.
- Press Continue.
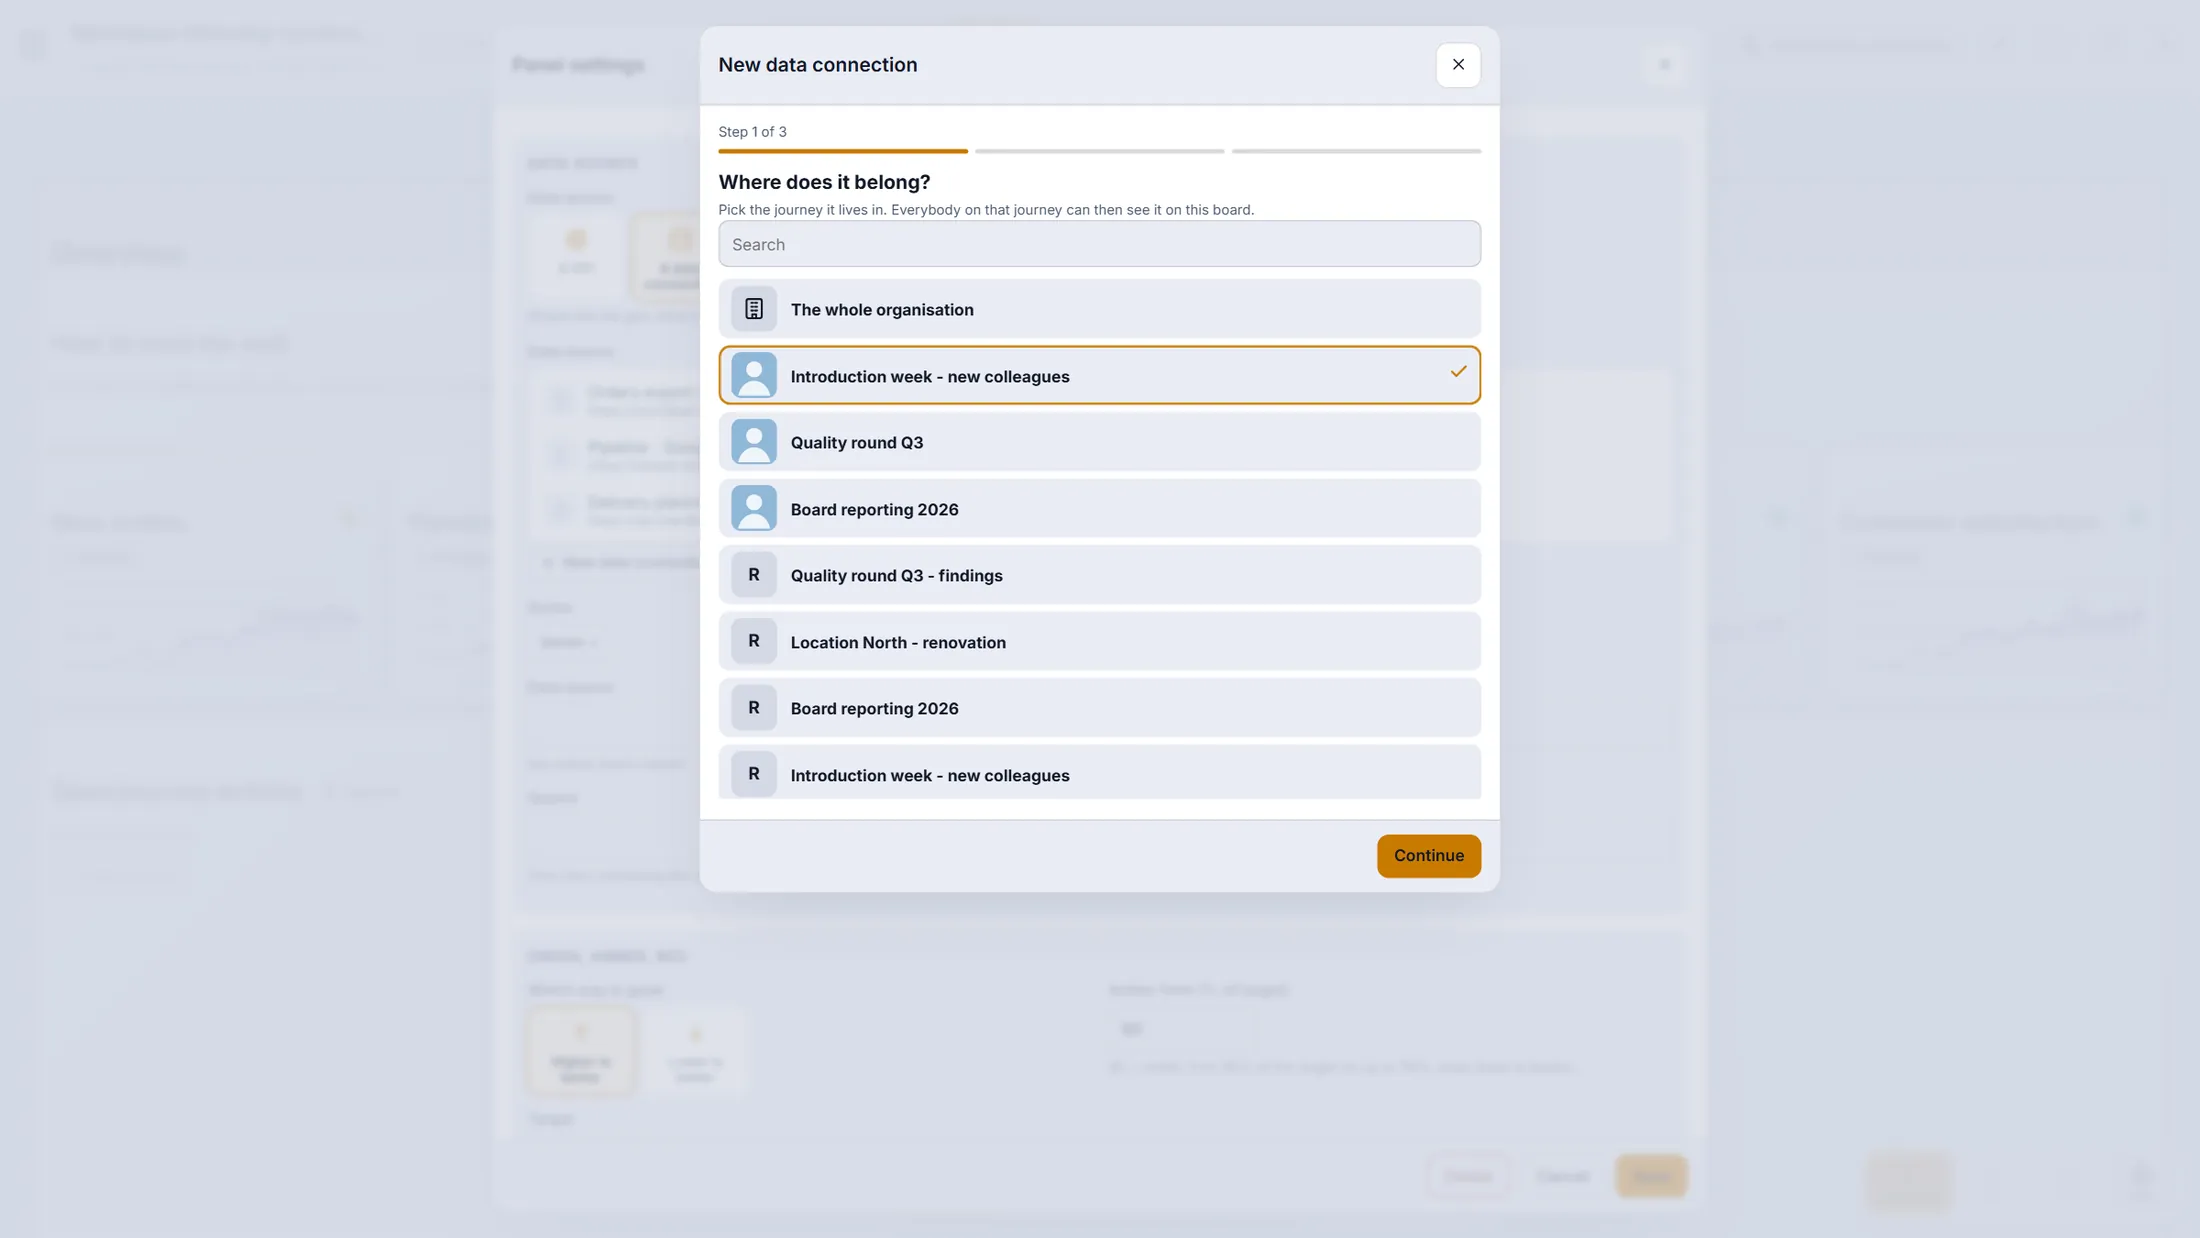
Step 1 of 3: where it belongs. A new connection: where do the numbers live?
Five cards. Pick where the numbers are.
- A web address: an https address that answers with JSON - almost every online tool has one (an API). You can add a key or sign-in.
- A CSV file: upload a .csv, .tsv or .txt export of up to 5 MB. The first row names the columns. You see a preview of the first rows.
- CSV in OneDrive and CSV in Google Drive: a CSV (or a Google Sheet) that stays where it is and is read again at every refresh - so the board follows the file.
- Live data: stocks, currencies, weather or crypto - no file needed (next step). Press Continue after your choice.
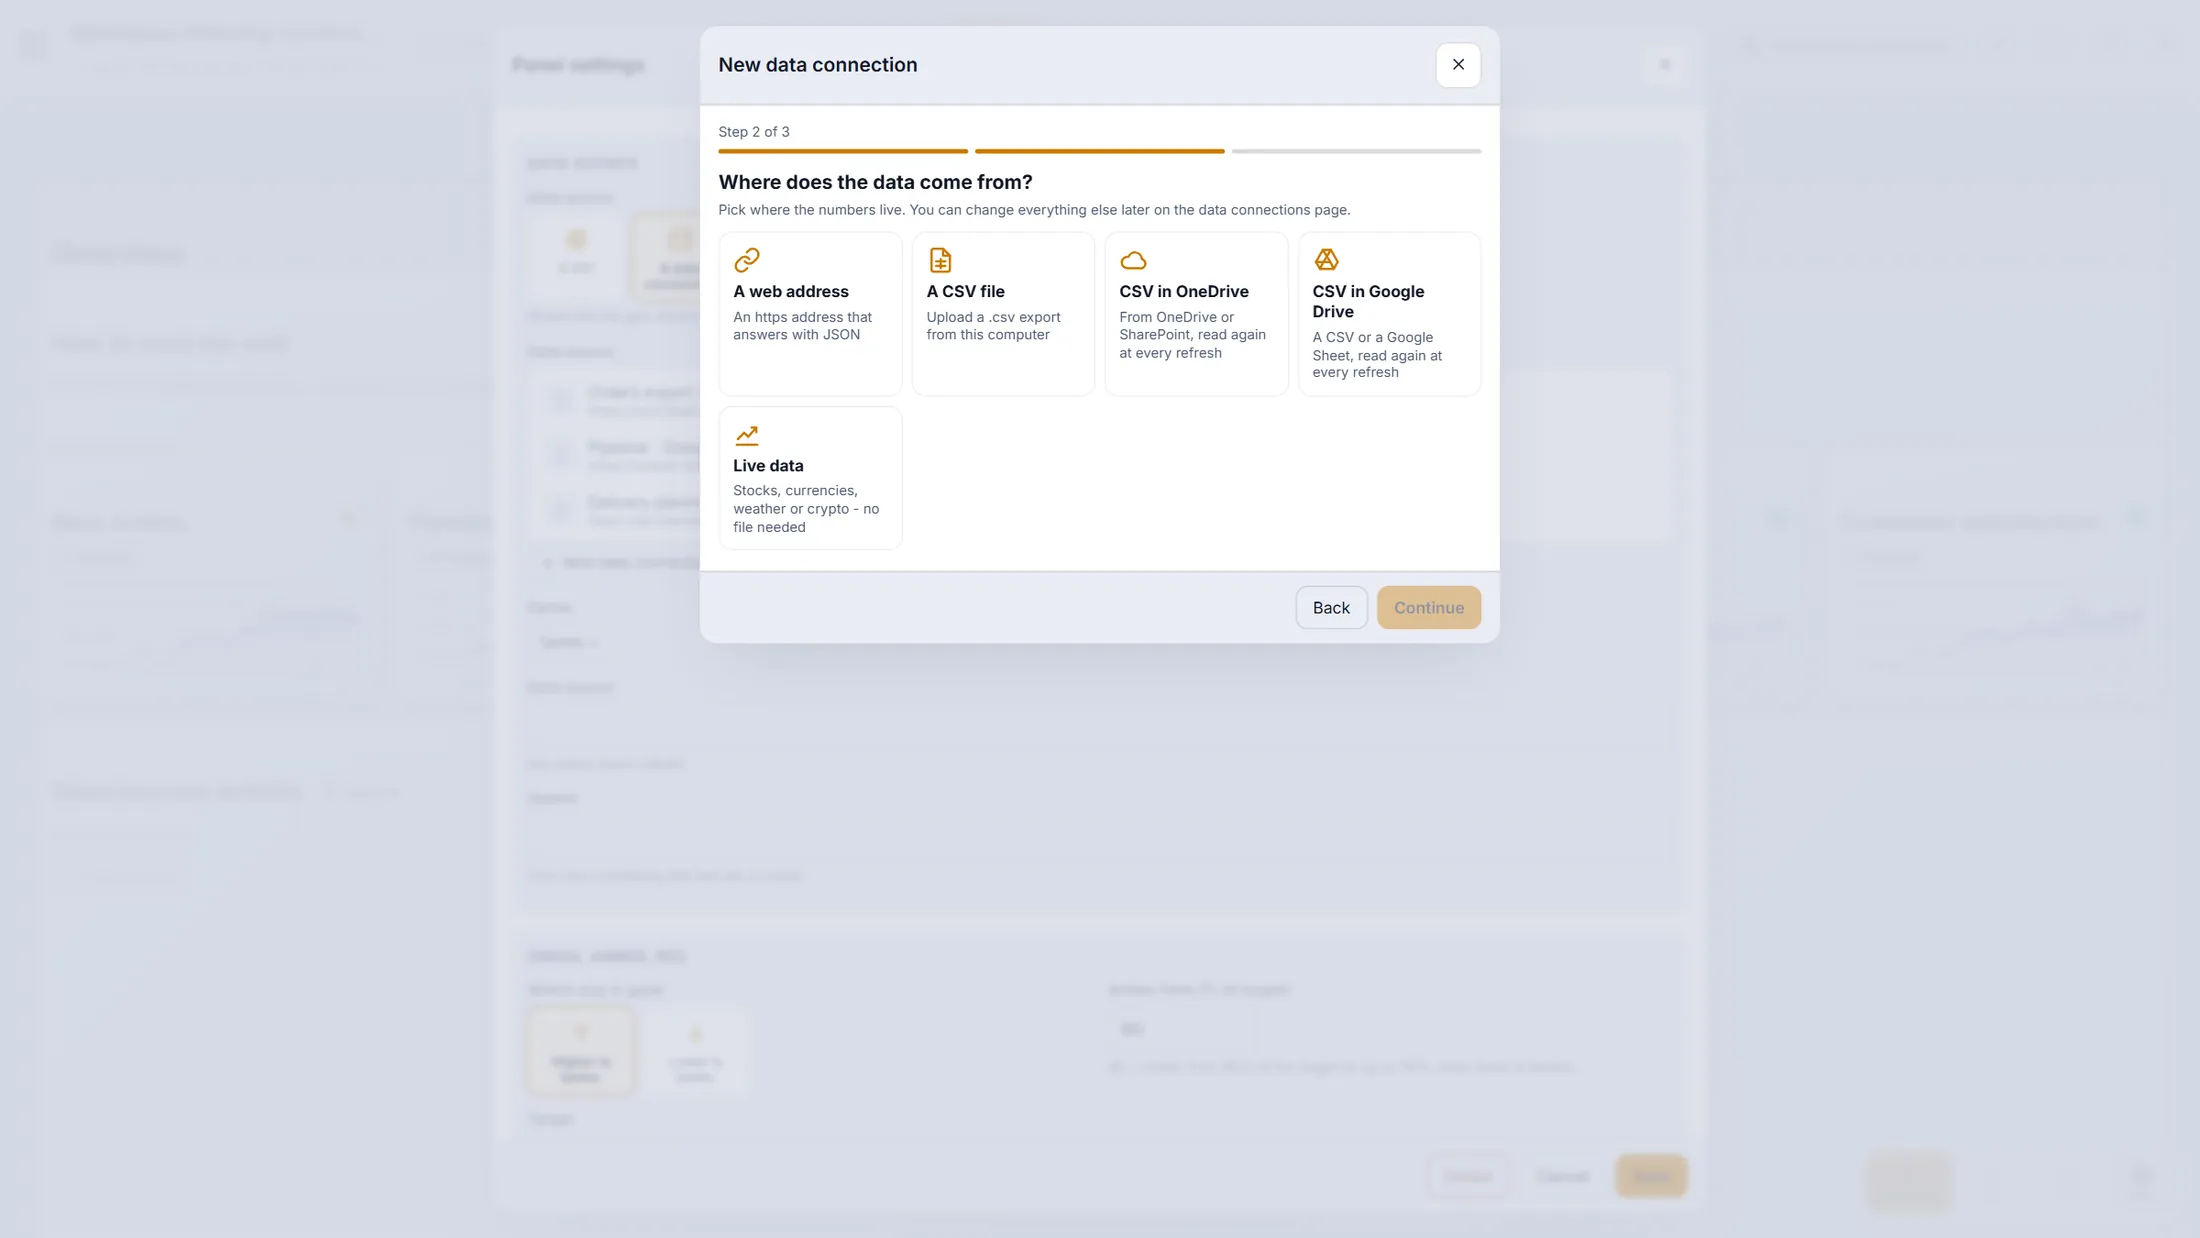
Five ways to bring data in. Live data, no file needed
Name the connection, pick what you want to follow, press Make it.
- Type a name people will recognise on the board, for example Euro rates .
- Pick one: Stocks & indices (symbols such as AAPL, MSFT), Currencies (from one currency, compared with others), Weather (search up to 5 places) or Crypto (coins, priced in a currency).
- Press Show live values to look, then Make it. The connection is made and the tile starts to follow it.
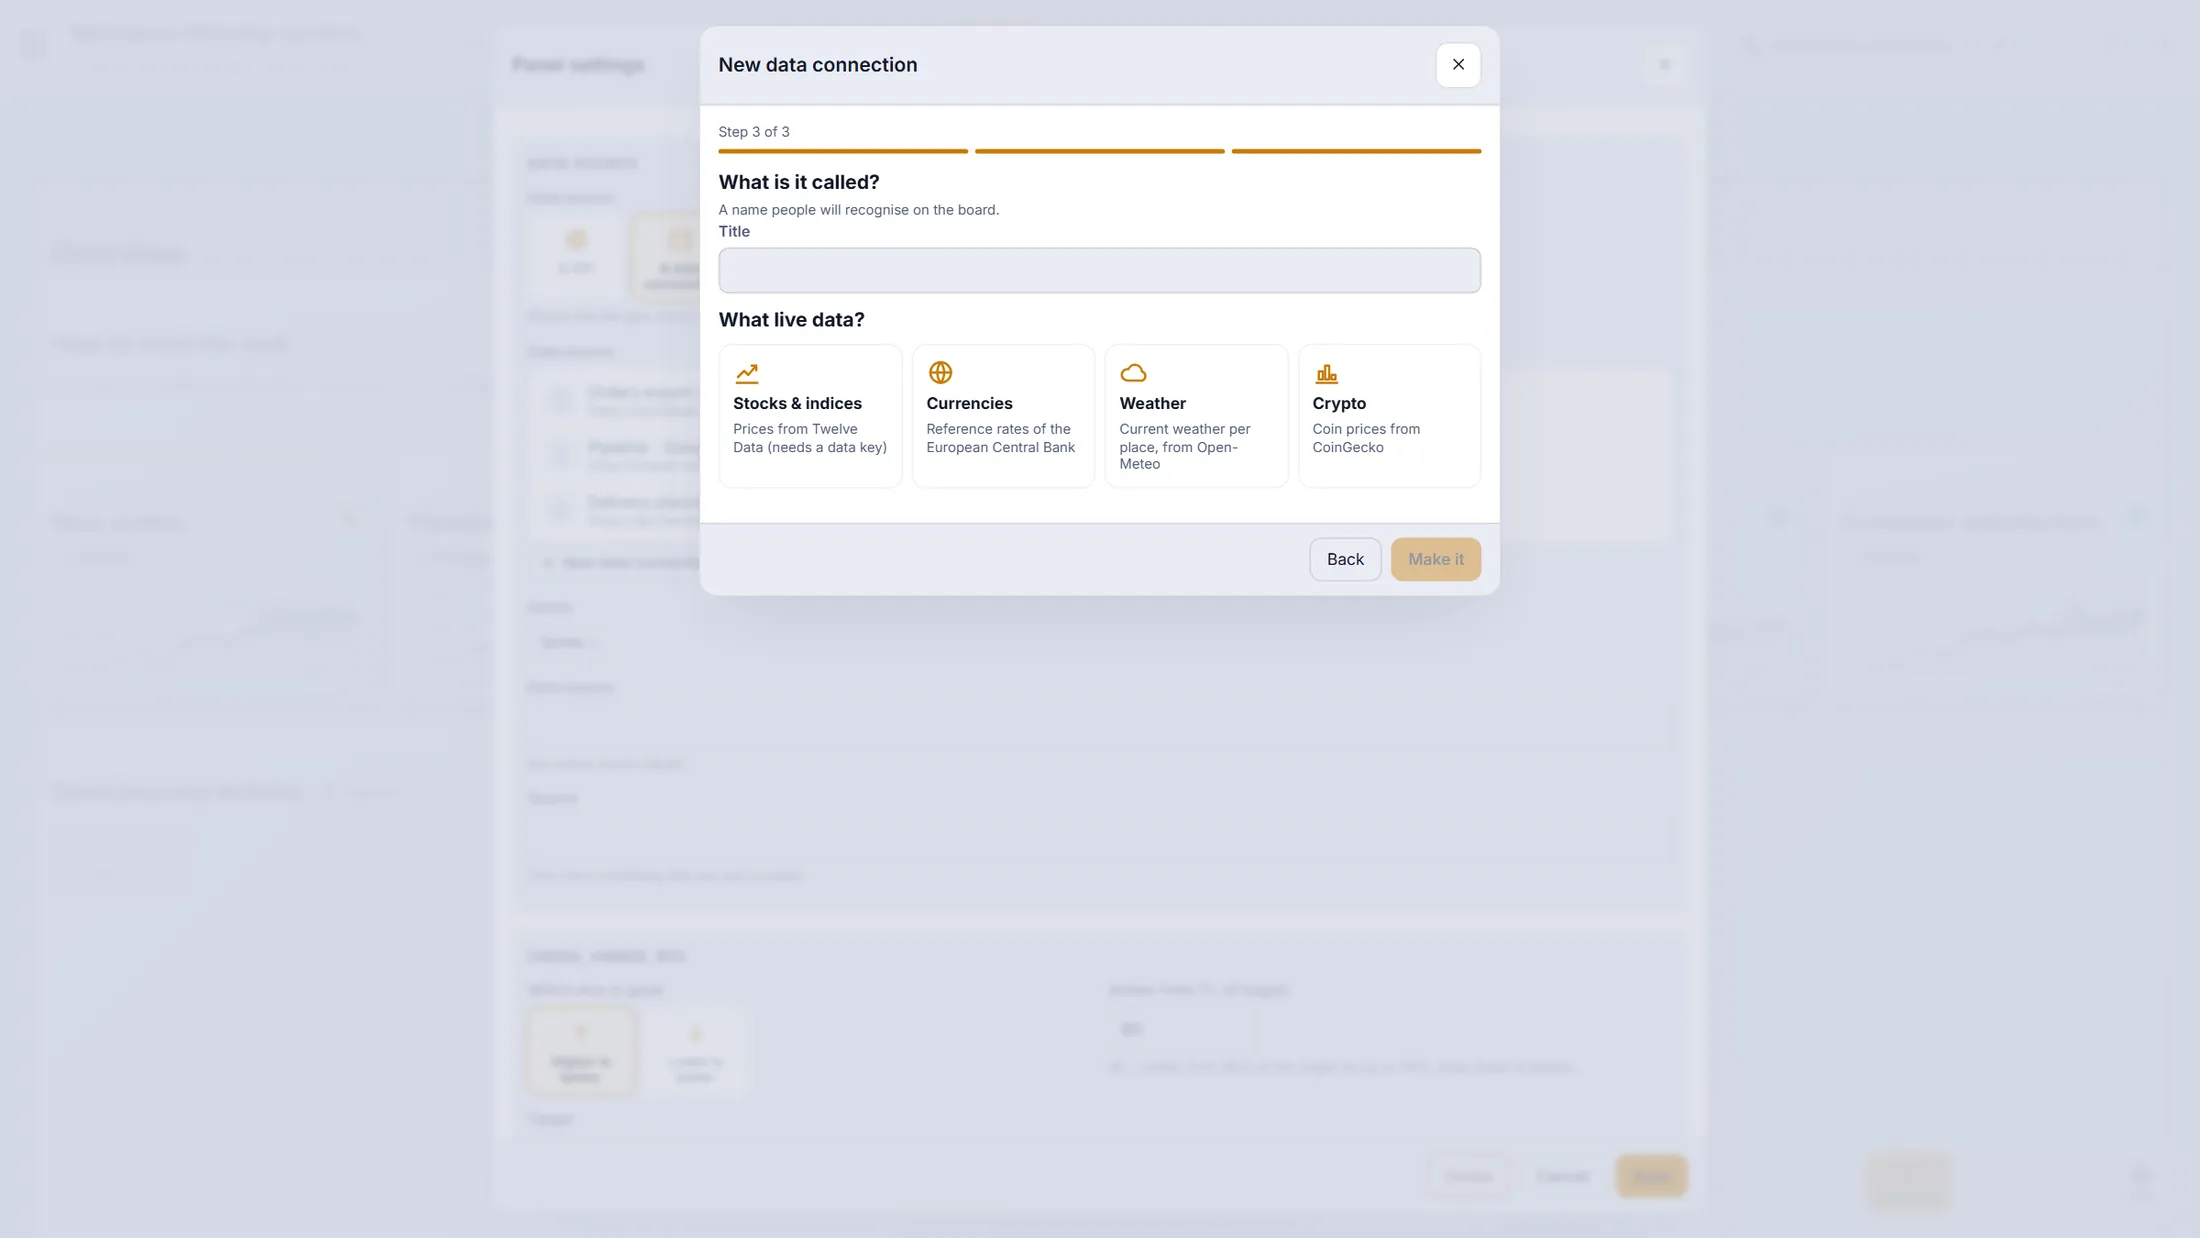
Live data: four kinds, no file. Type the numbers yourself
No source needed. The numbers are in the tile.
- Press Values typed in here.
- Each row is one point: a month ( 2026-05 ), its value ( 2430000 ) and, if you like, a target.
- Add rows at the bottom of the list, remove one with the bin. Press Save when it looks right.
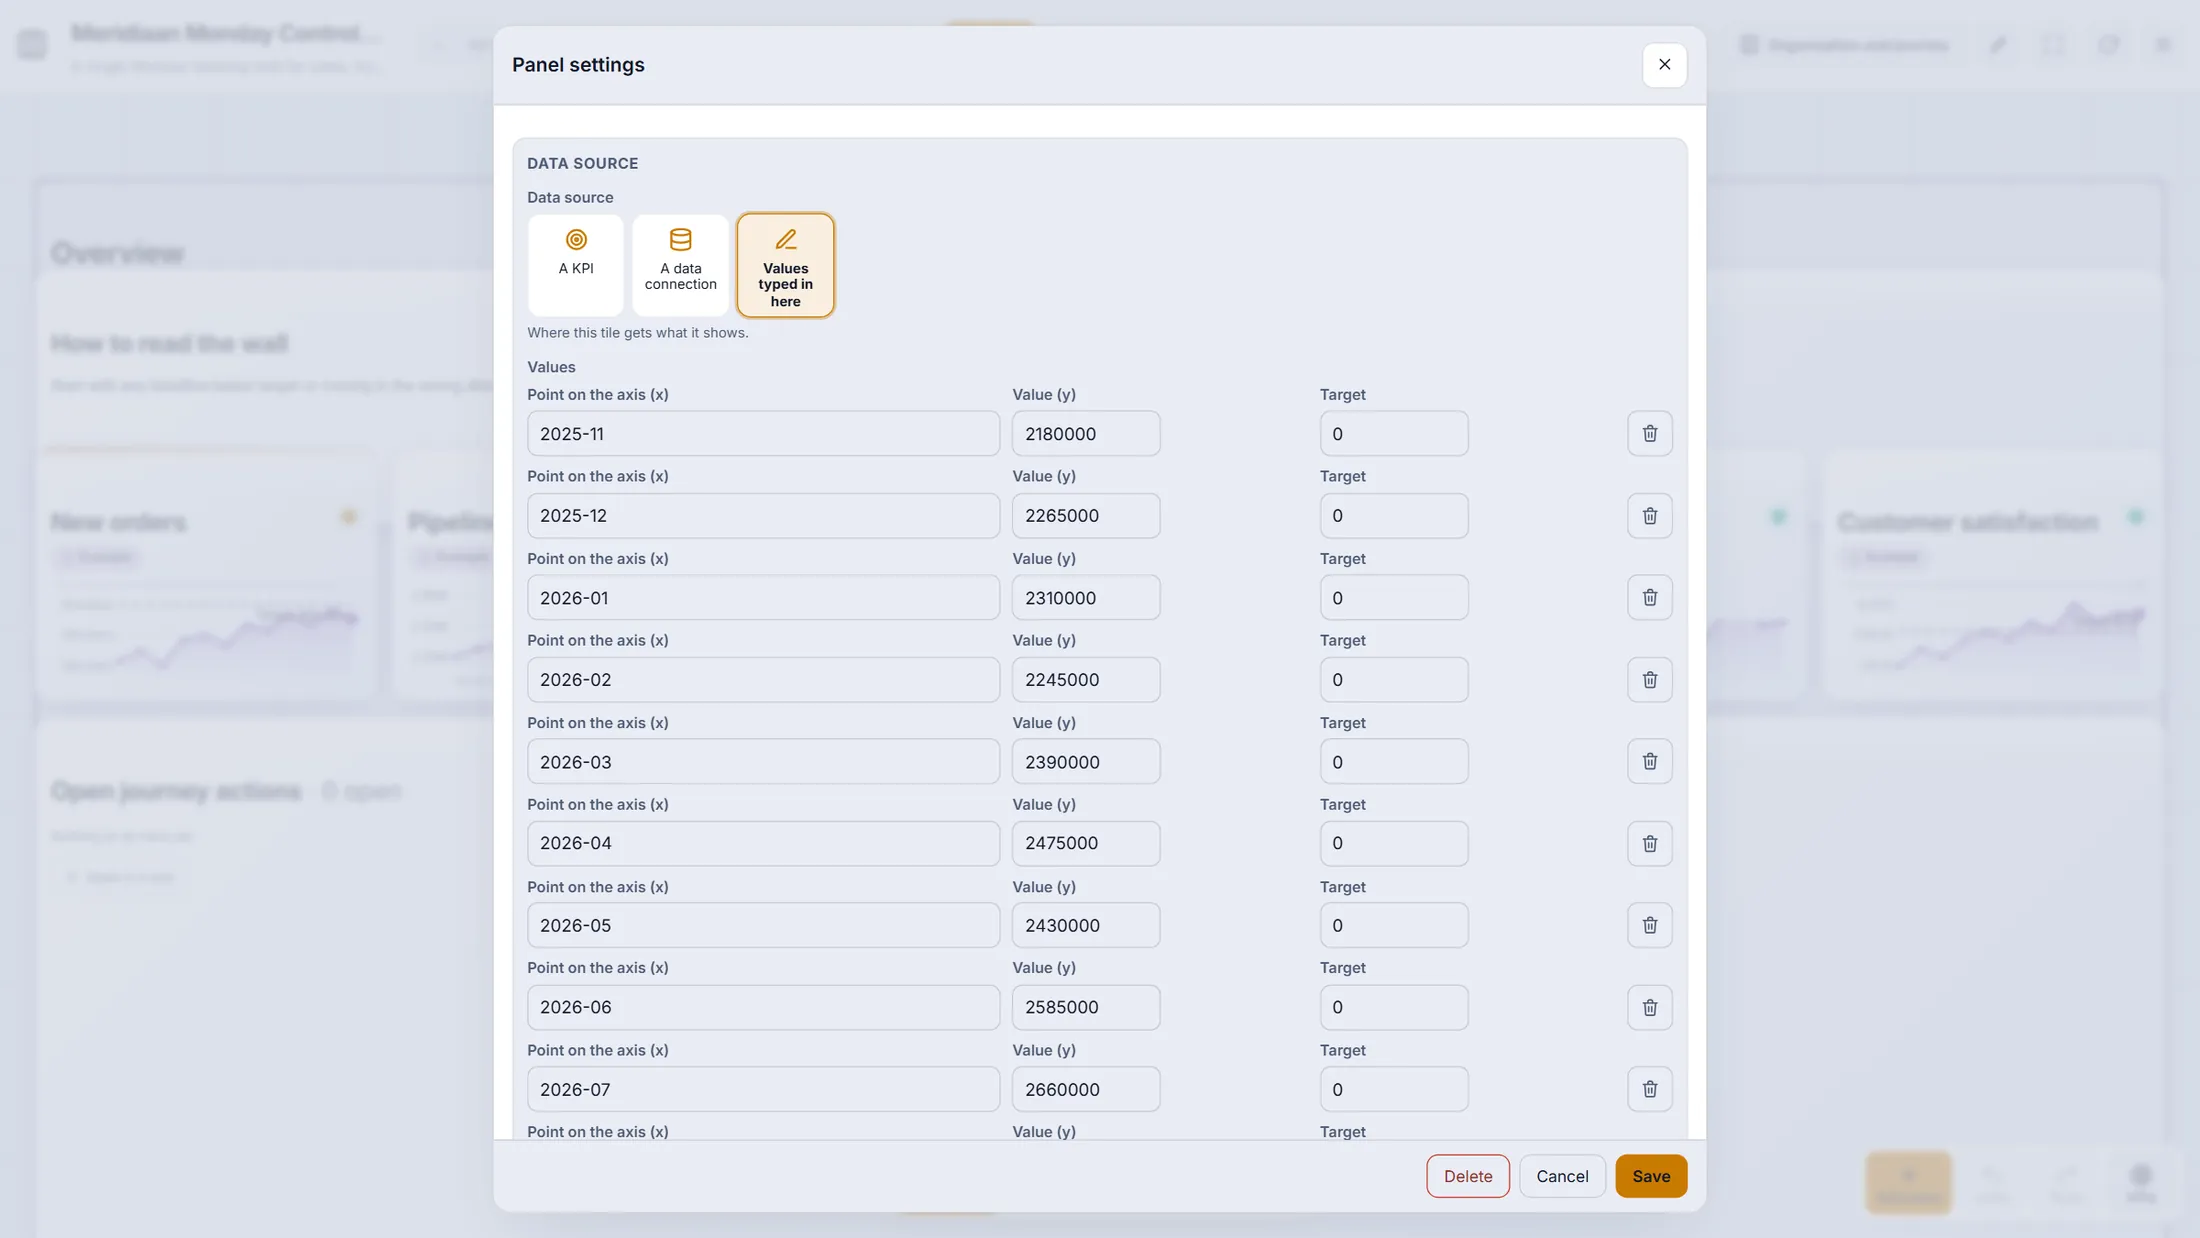
Typed points: month, value, target. Name it, share it
Press Board settings. Give the board a name and say who may see it.
- Press Board settings in the header.
- Fill in Title (the name in the header and the board list), a line icon and a Subtitle for the room.
- Visible for : Everybody in the organisation or Organisation admins only. At Journey choose which journey the board is about - that decides which projects, files, videos and people its tiles can reach.
- Extra allowed embed hosts : other websites the embed and video tiles may show, besides the ones CoVince already allows.
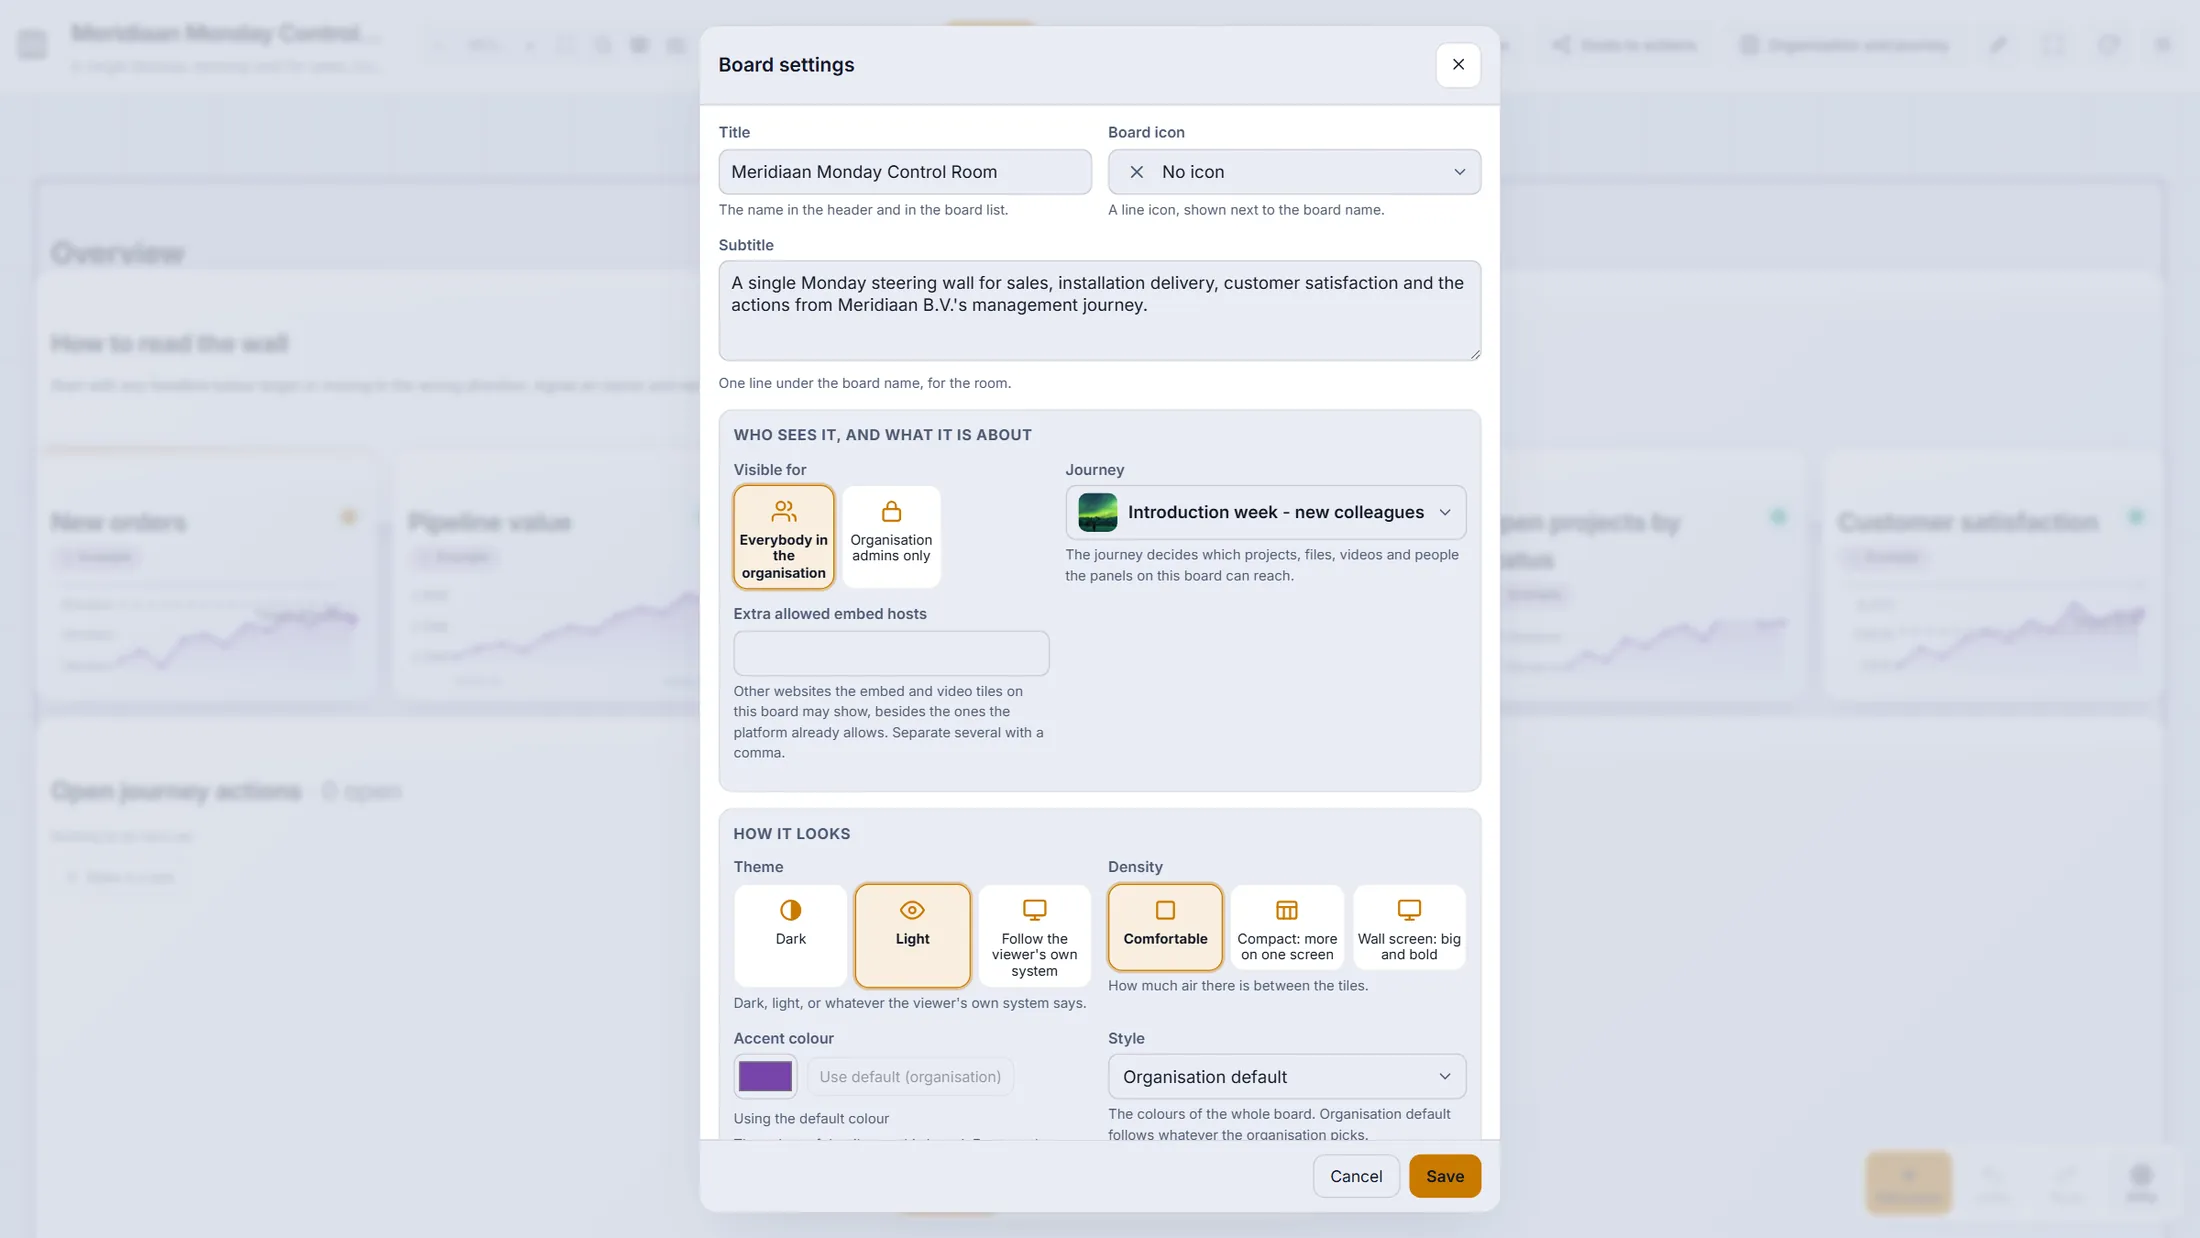
The first half of Board settings. Colours, size and screens
Scroll down in Board settings. Here you set how it looks and how big it is.
- Theme: the header has a sun/moon button, and a board can carry its own colour with Edit styles . A tile can overrule the colour in its own settings.
- Look : Modern (gradients) gives a shining gradient and soft glow; Classic is the flat look.
- Size : Blocks across (12 to 1024), Screen (one screen 16:9, up to nine portrait screens) and Content size - a slider that makes text, numbers and charts in the tiles bigger or smaller, so a big wall shows the same board at the size you want.
- On a wall screen : tick Turn the pages by themselves on a wall screen, set Seconds per page (here 20) and, if you like, a LATEST line with the newest alerts .
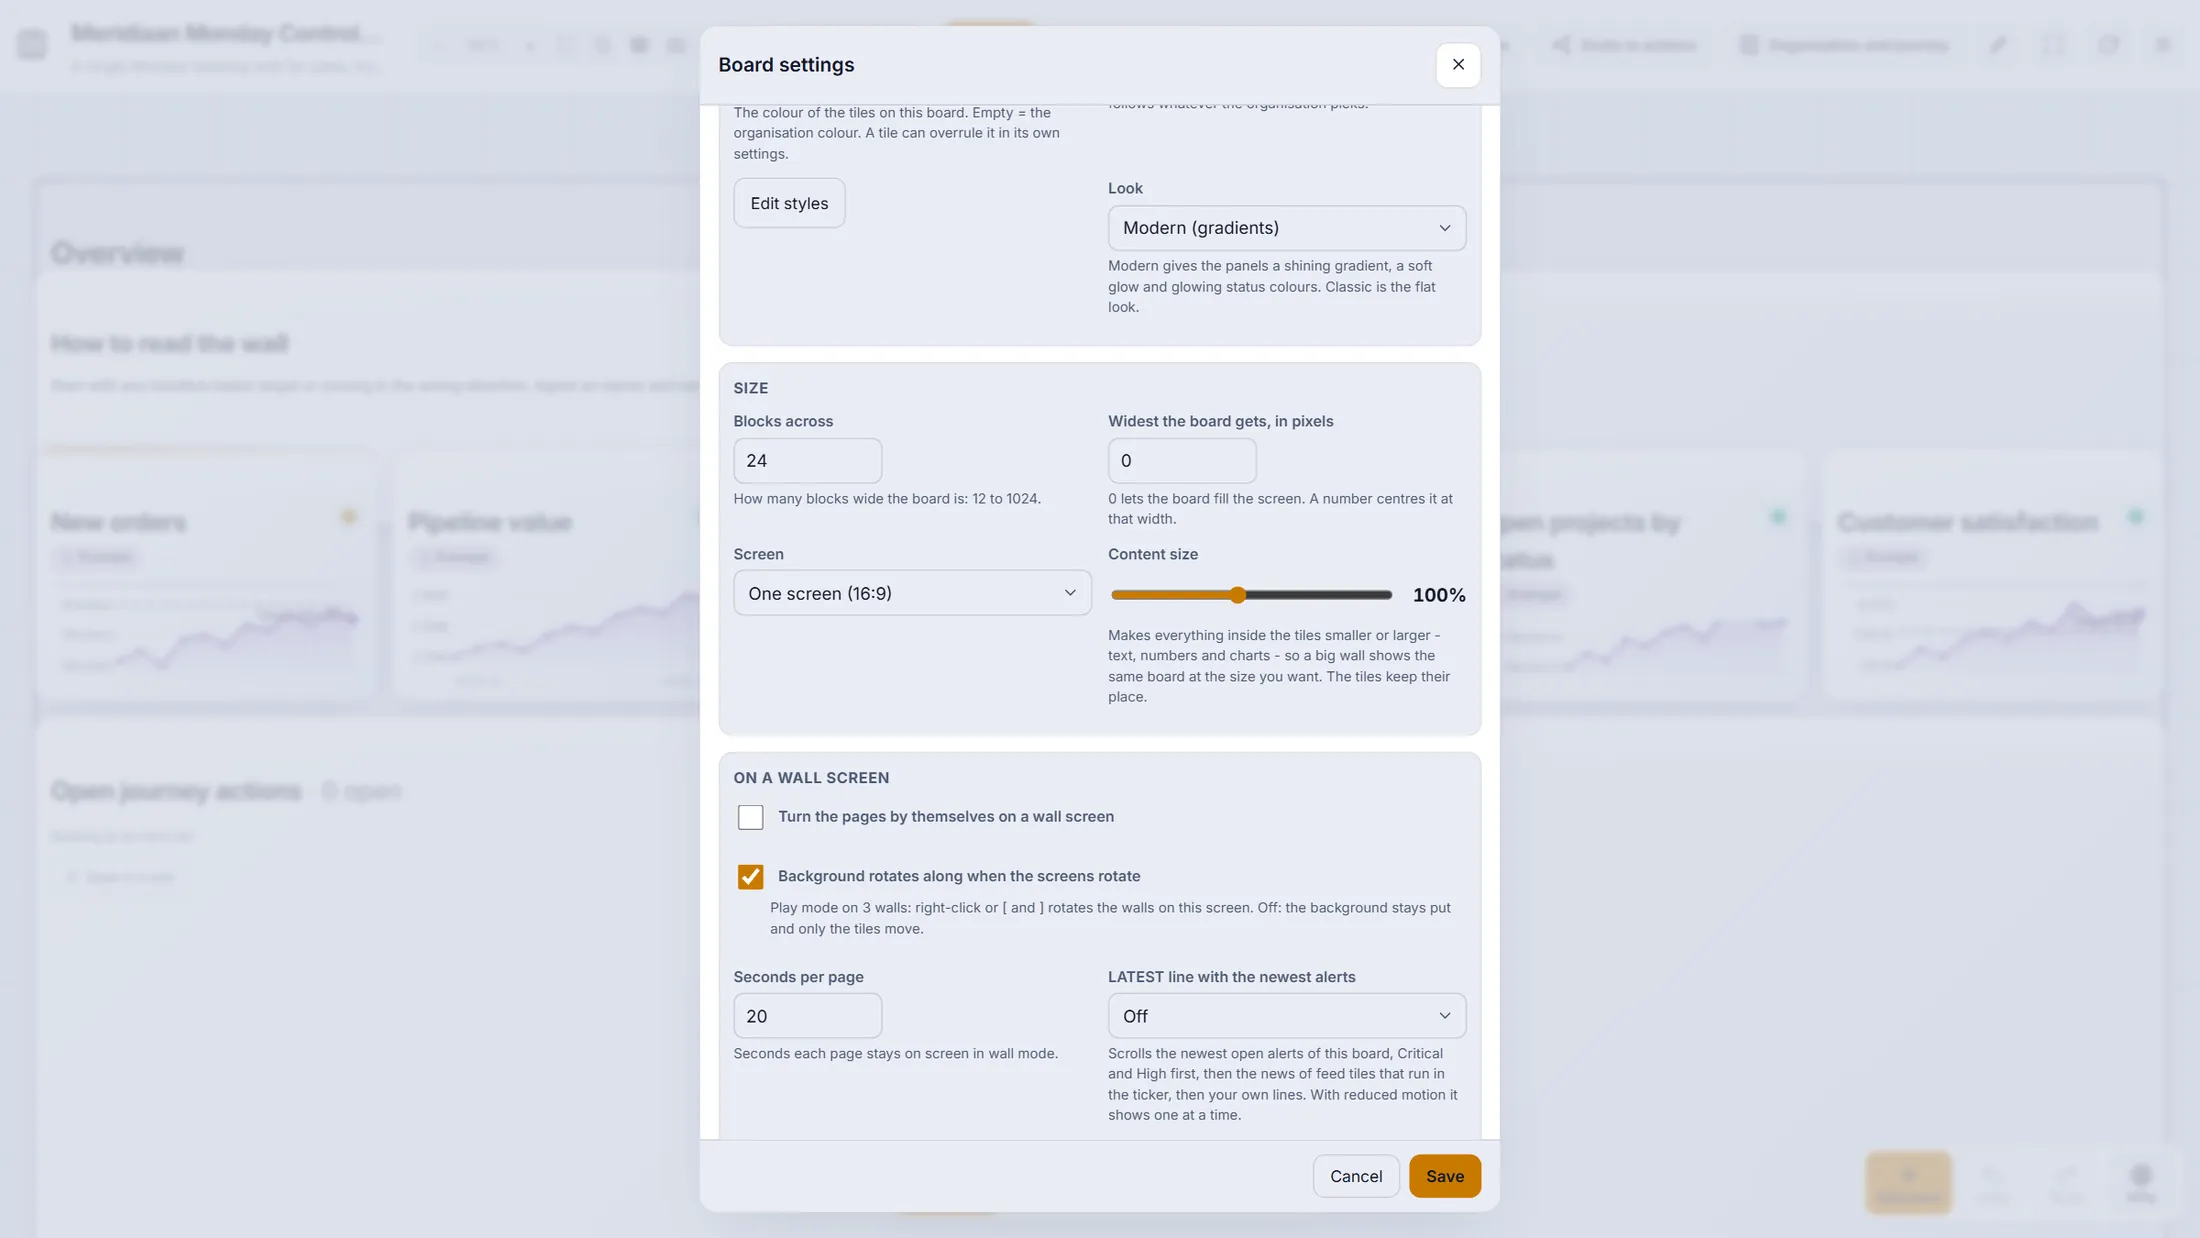
Look, size and the wall rhythm. Press Play for the wall
Press Play. The edit buttons disappear and the board is ready for a screen on the wall.
- Press Play in the header. The board shows without edit tools.
- Move through the pages with Left arrow and Right arrow, pause with Space, leave with Esc. Shift+F makes it full screen.
- A wall can open the board straight in this mode: add ?mode=wall to the address, or use the share link.
- Playing is a view: the board and its data stay untouched. Draw on the board for a meeting with Draw on the board - the drawing is a note, not part of the board.
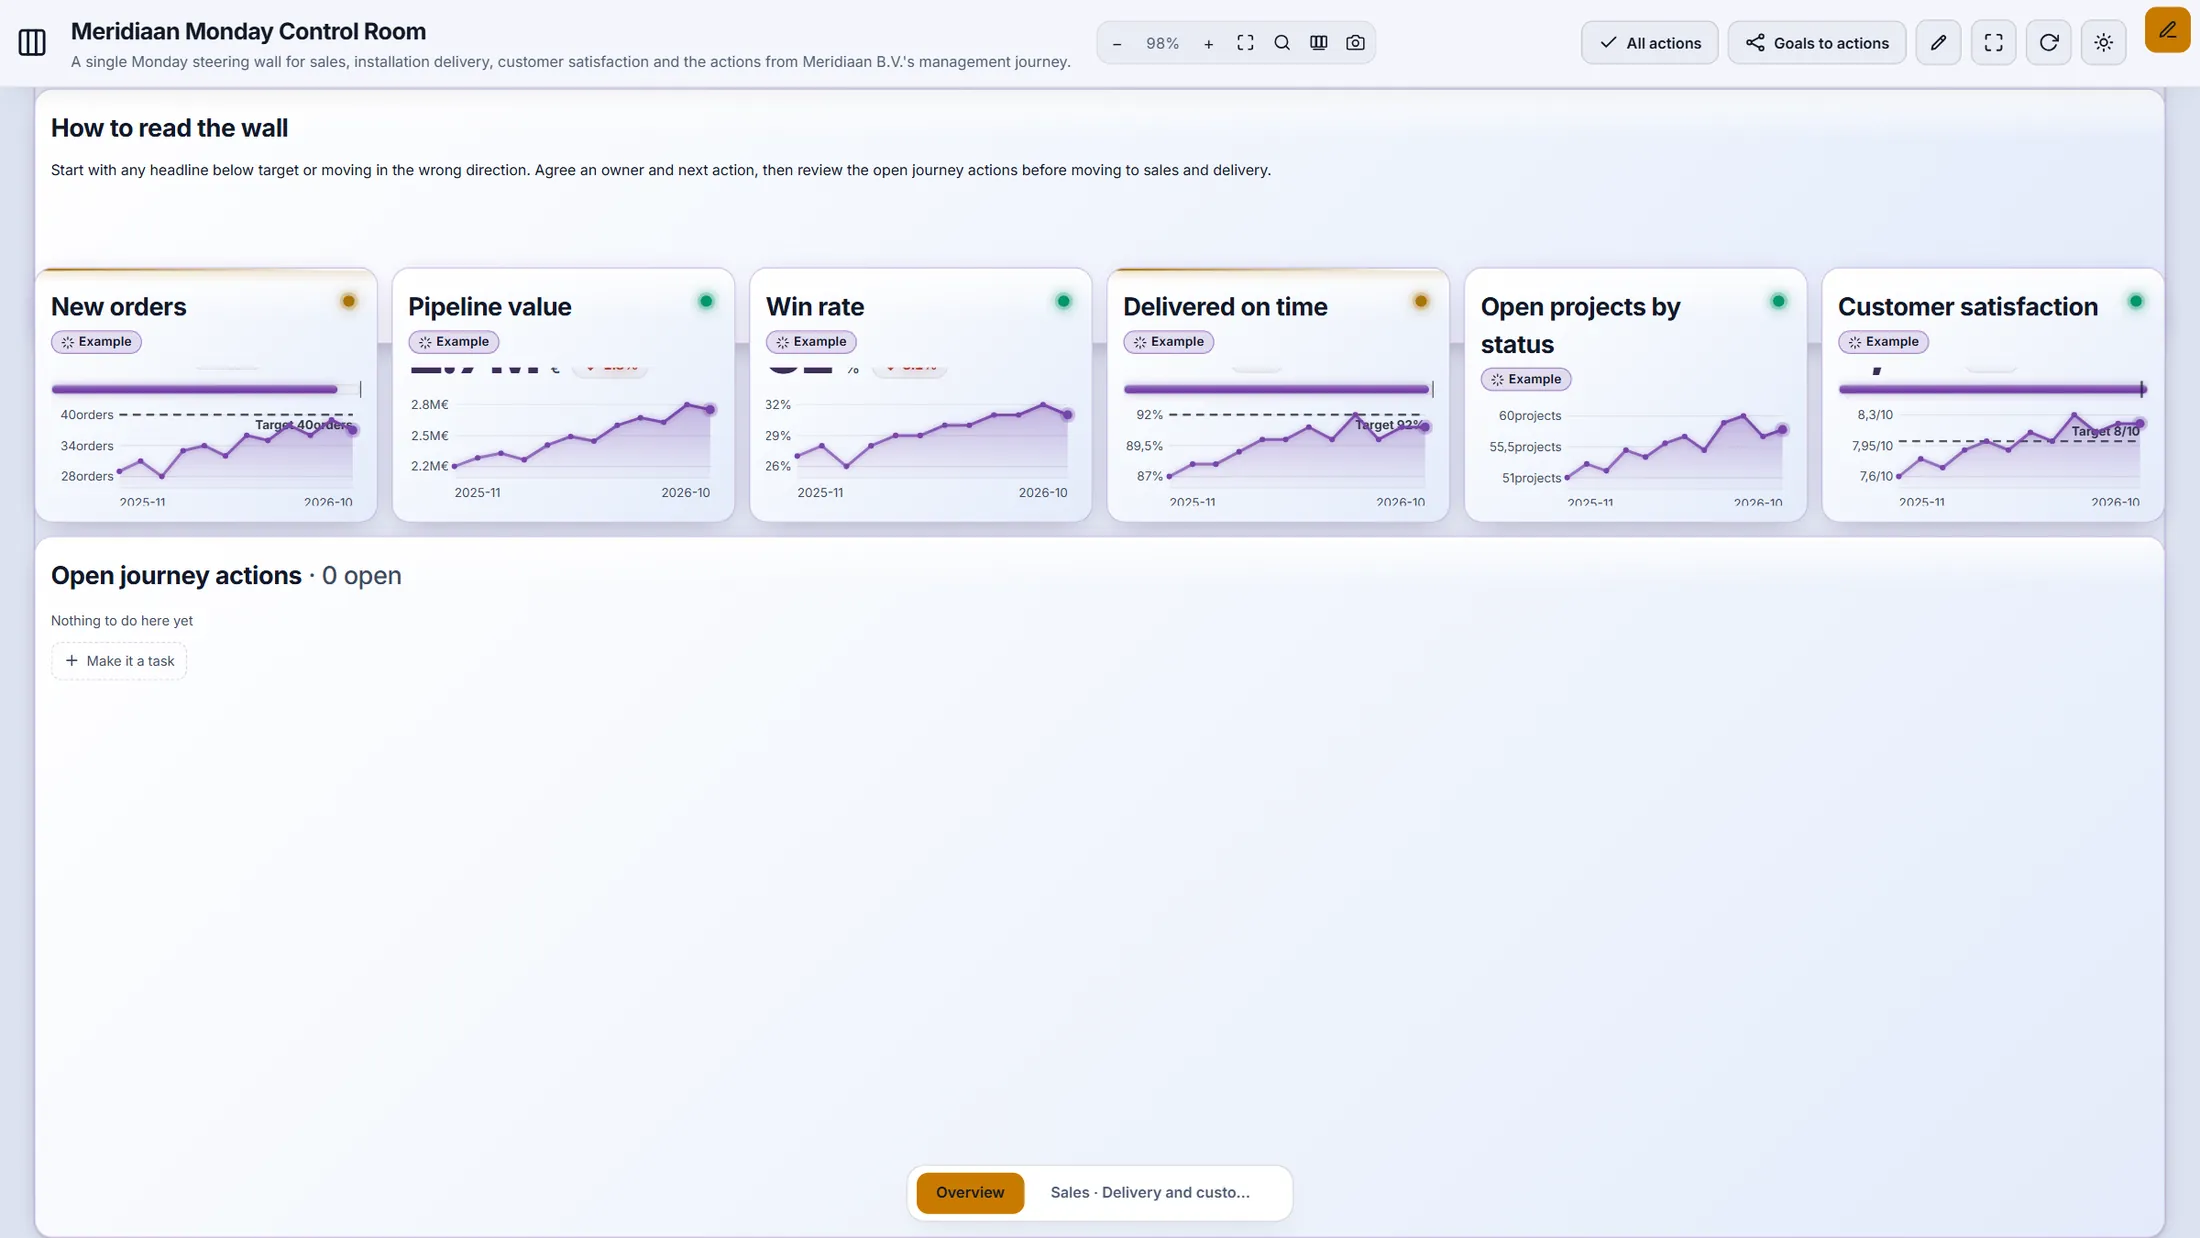
Play: only what a wall needs. The phone
Open the same board on a phone. The tiles stack, one under the other.
- Open the Control Room on your phone and pick the same board.
- Scroll down to read tile after tile. Press the three dots in the header for the rest of the tools.
- Press Show values or + Value on a tile to read or add a value right there.
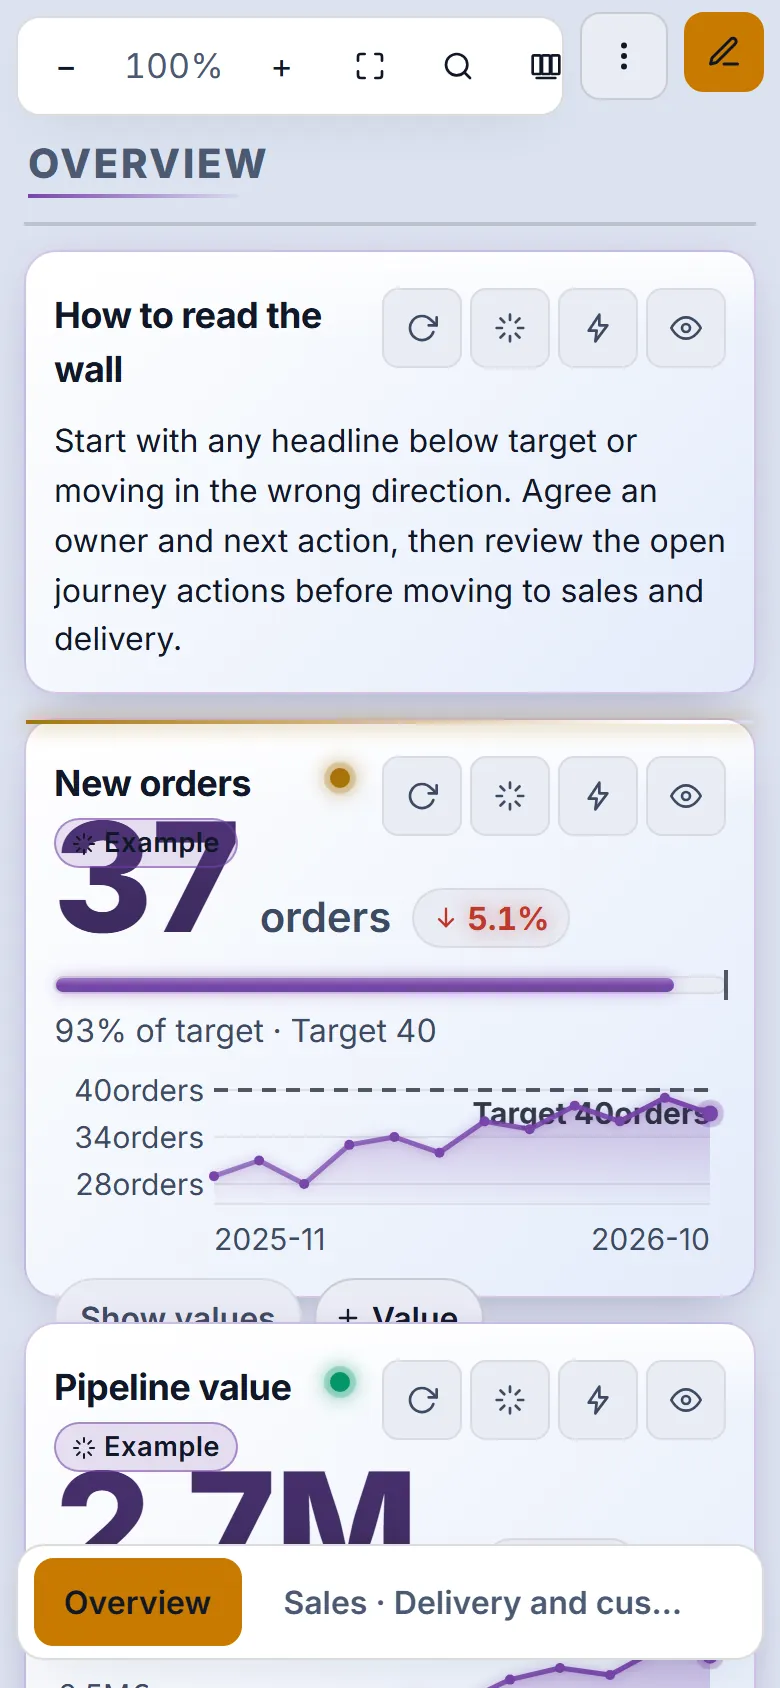
The phone: one column, big numbers, the same tools.
If something is not right
I see no pencil, no Make with AI.
Editing is for organisation admins. A member sees the board without edit tools - that is the wall.
A tile says Example.
Its numbers are examples from Make with AI. Connect a source or type the first value and your own numbers replace them; or use Remove all example data at the end of the wizard.
My data connection shows nothing.
Open the Data connections page and use its test: it shows what the address answers, the fields it found and any error. After repeated failures a connection pauses itself and says so.
Who can see the numbers?
The board says who: Visible for - everybody in the organisation or admins only. A data connection has its own scope too, and a secret is never shown again after saving.
Can two people edit at once?
Yes. A change by somebody else arrives by itself; while you edit it waits in a small chip, and Undo and Redo walk through your own changes.
The words, in plain language
- board
- The whole Control Room of one organisation and journey: pages with tiles.
- tile
- One box on a page: a number, a chart, a list, a map, a note, a video...
- KPI
- A measure you follow: a target, a period and the values over time.
- data connection
- The address and sign-in of a source, kept once and used by many tiles.
- series
- One line or set of bars drawn from a data connection: which column, filtered, grouped, summed.
- wall mode
- Play: the board without edit tools, for a screen on the wall.
Where to go next
- Make a Control Room with AI Describe it and CoVince builds the board for you.
- All explainers The other things you can learn here.